Unlock a world of possibilities! Login now and discover the exclusive benefits awaiting you.
- Qlik Community
- :
- All Forums
- :
- QlikView App Dev
- :
- Re: Is their any formatting options for trend line...
- Subscribe to RSS Feed
- Mark Topic as New
- Mark Topic as Read
- Float this Topic for Current User
- Bookmark
- Subscribe
- Mute
- Printer Friendly Page
- Mark as New
- Bookmark
- Subscribe
- Mute
- Subscribe to RSS Feed
- Permalink
- Report Inappropriate Content
Is their any formatting options for trend lines ( average , linear ..)?
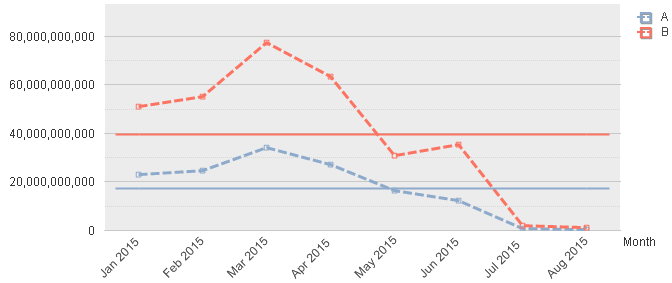
Hi All, I am new to Qlikview. I am working on one requirement for which I need to draw a line chart with 2 expressions & their averages. The average line must be a dotted / dashed straight horizontal line( not with up and down lines).
1) I am able to draw the same with trend line option, but user wants it as a dotted / dashed average trend line. I have not found any option to do the formatting on average trend lines. Please help.
2) I have tried with 4 expressions & here I can do the formatting on average lines, but the average line is not a dotted / dashed straight horizontal line( not with up and down lines).
I hope I am able to post my requirements. Please help me on this issue & Let me know if you need anymore details.
Thanks
Sattya
Accepted Solutions
- Mark as New
- Bookmark
- Subscribe
- Mute
- Subscribe to RSS Feed
- Permalink
- Report Inappropriate Content
1. There is no way to format the trend line on my knowledge
2. You can achieve the same average lines with line expressions rather than the trend. If you see the lines going up and down then you are letting it calculate according to the dimension. Calculate the average in a variable and use the variable in line expression to get the trends. you can set the style in line format. '<S1>' to '<S4>'
3. I guess only those are avaialbe in reference line.
REgards,
Sundar
- Mark as New
- Bookmark
- Subscribe
- Mute
- Subscribe to RSS Feed
- Permalink
- Report Inappropriate Content
Hi satish,
Use Reference Line Option from Presentation Tab.
--> Click on the Add button at Reference Line. --> You can able to see Line formatting.
HTH
Naresh
- Mark as New
- Bookmark
- Subscribe
- Mute
- Subscribe to RSS Feed
- Permalink
- Report Inappropriate Content
Hi Sattya,
Am not completely clear about the requirement. Plese correct me if am wrong.
If you want an average line to be drawn with dotted fashon you can do it with reference line as shown below which has dotted lines. Use the expression part to calculate average.
or you can use a line expression to achieve it , you should be formatting the line with line style as '<S2>' , s3 and s4 will give different lines. to make it a straight line , calculate the average in a variable and use the variable in the line expression. ie. write variable expression as "=expression"(preceding = sign)
Hope this helps. If you have a different scenario , pls post a sample..
Regards,
Sundar
- Mark as New
- Bookmark
- Subscribe
- Mute
- Subscribe to RSS Feed
- Permalink
- Report Inappropriate Content
Thanks Naresh & Sundar for reply. Please check below details :
1) Can we do formatting on trendlines?

2) I want to draw a line chart like as below, here I have used 2 expressions with 2 Average-Trendlines for each expressions. This is perfect as per requirement but only change is user want average dotted/dashed lines.

3) In the reference line we can only change the line style as dotted/dashed.
- Mark as New
- Bookmark
- Subscribe
- Mute
- Subscribe to RSS Feed
- Permalink
- Report Inappropriate Content
1. There is no way to format the trend line on my knowledge
2. You can achieve the same average lines with line expressions rather than the trend. If you see the lines going up and down then you are letting it calculate according to the dimension. Calculate the average in a variable and use the variable in line expression to get the trends. you can set the style in line format. '<S1>' to '<S4>'
3. I guess only those are avaialbe in reference line.
REgards,
Sundar
- Mark as New
- Bookmark
- Subscribe
- Mute
- Subscribe to RSS Feed
- Permalink
- Report Inappropriate Content
Thanks Sundar. Variable expression is working fine. Thanks a lot for your quick help.
Just a question, why same formula is not working without a variable??
- Mark as New
- Bookmark
- Subscribe
- Mute
- Subscribe to RSS Feed
- Permalink
- Report Inappropriate Content
Thanks Sundar. Variable expression is working fine. Thanks a lot for your quick help.
Just a question, why same formula is not working without a variable??
- Mark as New
- Bookmark
- Subscribe
- Mute
- Subscribe to RSS Feed
- Permalink
- Report Inappropriate Content
It is because witha a variable, you are already calculating the average outside of the chart, where there is no influence of the dimensions of chart.
This works only if you write the variable as "=variable_expression".
if you write the same without equal sign it is the same as expression written in the chart itself "variable_expression".
Regards,
Sundar
- Mark as New
- Bookmark
- Subscribe
- Mute
- Subscribe to RSS Feed
- Permalink
- Report Inappropriate Content
Great. Thanks a lot.
- Mark as New
- Bookmark
- Subscribe
- Mute
- Subscribe to RSS Feed
- Permalink
- Report Inappropriate Content
You are welcome. Please close the thread by marking the correct answer![]()
-Sundar