Unlock a world of possibilities! Login now and discover the exclusive benefits awaiting you.
- Qlik Community
- :
- All Forums
- :
- QlikView App Dev
- :
- Is there a way to create a scatter plot with each ...
- Subscribe to RSS Feed
- Mark Topic as New
- Mark Topic as Read
- Float this Topic for Current User
- Bookmark
- Subscribe
- Mute
- Printer Friendly Page
- Mark as New
- Bookmark
- Subscribe
- Mute
- Subscribe to RSS Feed
- Permalink
- Report Inappropriate Content
Is there a way to create a scatter plot with each row represented as a mark?
I am trying to create a simple scatter plot that plots one column from my data on the x-axis, and another column on the y-axis for every row. For example, if I wanted to plot "age" on the x-axis and "height" on my y-axis for middle schoolers, I'd want to want a mark on the scatter plot for every child, then maybe see some trend lines running through the data.
I am currently unable to disaggregate either axis, and don't see a way where I can avoid using Sum or Avg. I know that I must also provide a dimension to a scatter plot, but as my example above shows, I do not have a need for one. I can use something like "gender" for my dimension, but this will end up only giving me two marks on the scatter plot, which would either be the sum or average of "age" and "height."
I have also read this thread as well: Very basic Scatter chart in Qlikview. I do not see the answer to user louiseward's question, and the example provided is a different use case from mine as well. Any help would be greatly appreciated, thanks!
- Tags:
- new_to_qlikview
Accepted Solutions
- Mark as New
- Bookmark
- Subscribe
- Mute
- Subscribe to RSS Feed
- Permalink
- Report Inappropriate Content
You need to have an ID per row in your data. If you don't have one, I suggest you create such an ID when you load your data, e.g. by
RecNo() as ID
Then use this as dimension in your scatter chart.
If you only have one age and one height per row, you don't need to use Sum() or Avg(). You can just use these fields as they are.
HIC
- Mark as New
- Bookmark
- Subscribe
- Mute
- Subscribe to RSS Feed
- Permalink
- Report Inappropriate Content
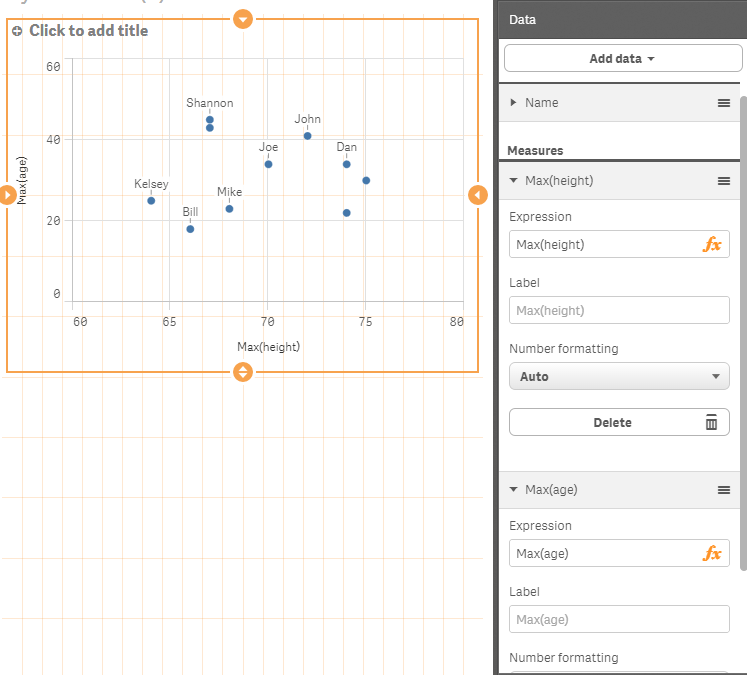
Try making height and age as measures and choosing them as just MAX(height), MAX(Age), and then choose the persons name as the dimension. I converted the height to be in only inches here is what I came up with:

- Mark as New
- Bookmark
- Subscribe
- Mute
- Subscribe to RSS Feed
- Permalink
- Report Inappropriate Content
use a personID as dimension and simply age and height as expressions.
regards
Marco
- Mark as New
- Bookmark
- Subscribe
- Mute
- Subscribe to RSS Feed
- Permalink
- Report Inappropriate Content
You need to have an ID per row in your data. If you don't have one, I suggest you create such an ID when you load your data, e.g. by
RecNo() as ID
Then use this as dimension in your scatter chart.
If you only have one age and one height per row, you don't need to use Sum() or Avg(). You can just use these fields as they are.
HIC