Unlock a world of possibilities! Login now and discover the exclusive benefits awaiting you.
- Qlik Community
- :
- All Forums
- :
- QlikView App Dev
- :
- Re: Is there a way to switch rows with column in a...
- Subscribe to RSS Feed
- Mark Topic as New
- Mark Topic as Read
- Float this Topic for Current User
- Bookmark
- Subscribe
- Mute
- Printer Friendly Page
- Mark as New
- Bookmark
- Subscribe
- Mute
- Subscribe to RSS Feed
- Permalink
- Report Inappropriate Content
Is there a way to switch rows with column in a bar chart ?
Hi there,
I have a bar chart with one dimension and 4 expressions and I need to switch the rows with columns for a better visualization.
In excel there is a button (switch row/column) ... Is there any similar solution that is simple ? 
Thanks,
Mihai
- Mark as New
- Bookmark
- Subscribe
- Mute
- Subscribe to RSS Feed
- Permalink
- Report Inappropriate Content
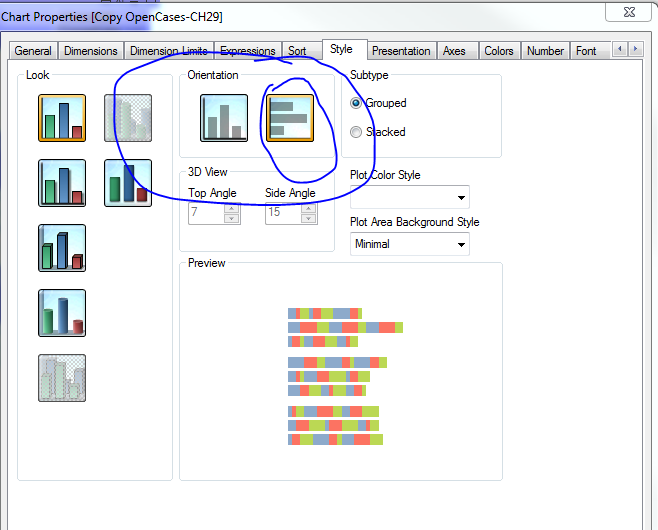
Are you looking to change the orientation of the chart? If that's what you want, you should be able to do that on the Style tab of the chart properties
- Mark as New
- Bookmark
- Subscribe
- Mute
- Subscribe to RSS Feed
- Permalink
- Report Inappropriate Content
Hi Sunny, thanks for your answer.
Here is a picture that illustrates my question.
Thanks.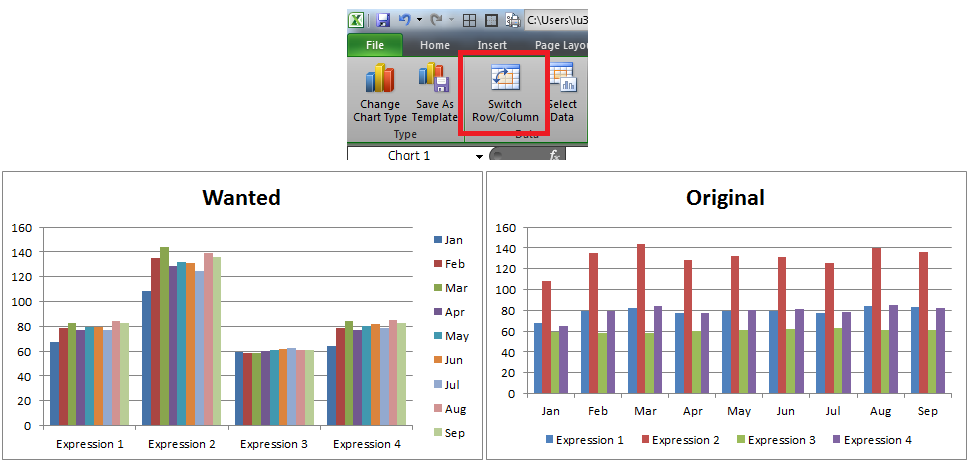
- Mark as New
- Bookmark
- Subscribe
- Mute
- Subscribe to RSS Feed
- Permalink
- Report Inappropriate Content
Seems like you need to change the order of your dimension. Make Month your second dimension and see if that helps
- Mark as New
- Bookmark
- Subscribe
- Mute
- Subscribe to RSS Feed
- Permalink
- Report Inappropriate Content
As I initially mentioned, in my QlikView app I have only one dimension (month) and 4 expressions ...
In the above example from Excel, that's the Original chart that I have in Qlik (with one dimension - Month and 4 expressions as Legend), and the Wanted example it's how I want to look in Qlik but I don't know how (month as Legend and expressions as dimension).
Of course, a solution could be to make 4 graphs with no borders, hidden axes, same min/max ... but that's not very nice . I was simply wondering if there is a solution like the simple option in Excel.
Hope this clarifies my question.
- Mark as New
- Bookmark
- Subscribe
- Mute
- Subscribe to RSS Feed
- Permalink
- Report Inappropriate Content
This will be tricky. By Default you can't do that as You have one dimension. You would need to write equation for each month with no Dimension.
Probably somebody might give you a better solution
- Mark as New
- Bookmark
- Subscribe
- Mute
- Subscribe to RSS Feed
- Permalink
- Report Inappropriate Content
Not sure how your data is? Is this how it looks?
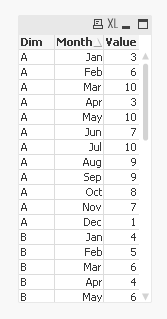
If your data doesn't look like that, I would suggest doing a The Crosstable Load to convert your data in the above format so that you can make your life easier.
Once you have the data in above format, all you need to do is use two dimensions with just 1 expression
Dimensions
Dim
Month
Expressions
Value
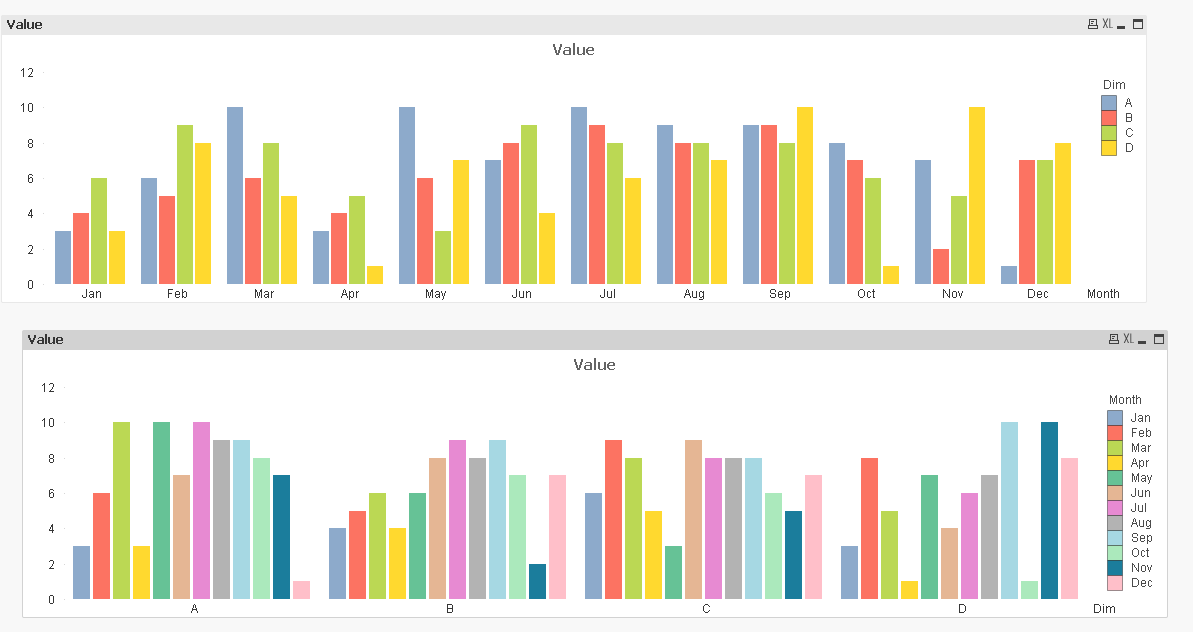
The difference between the above two charts is the order of the dimension. 1st one has Month as 1st dimension and Dim as 2nd and the second chart just reverses the order.
- Mark as New
- Bookmark
- Subscribe
- Mute
- Subscribe to RSS Feed
- Permalink
- Report Inappropriate Content
I'm not sure if this qualifies as simple, but you could add a data island:
Expressions:
LOAD dual(Expression,recno()) as Expression
INLINE [
Expression
Expression1Name
Expression2Name
Expression3Name
Expression4Name
];
Use Expression as another dimension. Combine your four expressions into one:
pick(Expression,Expression1,Expression2,Expression3,Expression4)
Where you're replacing "Expression1" with whatever your first expression is, and so on. Now just swap the order of the dimensions, and it should change it back and forth.
- Mark as New
- Bookmark
- Subscribe
- Mute
- Subscribe to RSS Feed
- Permalink
- Report Inappropriate Content
Hi Mihai,
I would like to ask if you have come up with the solution on your problem? I am also in need of the switch row / column option qlikview but cant find the answer.
thanks in advance