Unlock a world of possibilities! Login now and discover the exclusive benefits awaiting you.
- Qlik Community
- :
- All Forums
- :
- QlikView App Dev
- :
- Re: Issue in Stack Bar Chart
- Subscribe to RSS Feed
- Mark Topic as New
- Mark Topic as Read
- Float this Topic for Current User
- Bookmark
- Subscribe
- Mute
- Printer Friendly Page
- Mark as New
- Bookmark
- Subscribe
- Mute
- Subscribe to RSS Feed
- Permalink
- Report Inappropriate Content
Issue in Stack Bar Chart
Hi Community,
I used Bar chart &
1)dimension-->branch_type
2)calculated dimension-->
if(match(branch_type,'DEPOT','FACTORY','PT','ST'),
(
if(Flag='RED','1',
if(Flag='YELLOW','2',
if(Flag='AMBER','3',
if(Flag='GREEN1','4'
))))))
----------------------------------------------------------------------------
RED--->param_value=<=-1 and param_value=>=-10
YELLOW--->param_value=<=-10.1 and param_value=>=-13.9
AMBER--->param_value=<=-14 and param_value=>=-17.9
GREEN--->param_value=<=-20
(Above are only names of color which are taken by creating Flag in script)
----------------------------------------------------------------------------
3) Expression
Count({$<param_name={'TEMP'},param_value={'<=-1'}>}param_value)/
Count(total <branch_type>{$<param_name={'TEMP'},param_value={'<=-1'}>}param_value)*100
it gives 400% which is wrong.
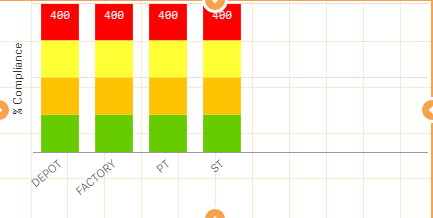
it should be 100% and there are diffrerent proportion for stacks for each branch_type
- Tags:
- new_to_qlikview
- « Previous Replies
-
- 1
- 2
- Next Replies »
- Mark as New
- Bookmark
- Subscribe
- Mute
- Subscribe to RSS Feed
- Permalink
- Report Inappropriate Content
Hello
Could you send a qvd ?
- Mark as New
- Bookmark
- Subscribe
- Mute
- Subscribe to RSS Feed
- Permalink
- Report Inappropriate Content
qvd?
you mean sample QVW
- Mark as New
- Bookmark
- Subscribe
- Mute
- Subscribe to RSS Feed
- Permalink
- Report Inappropriate Content
Ha ha,
looks like Qlik Sense to me, so it's a ,qvf 
Andy
- Mark as New
- Bookmark
- Subscribe
- Mute
- Subscribe to RSS Feed
- Permalink
- Report Inappropriate Content
yes andy 
but it won't work out in qv and Qs too.
- Mark as New
- Bookmark
- Subscribe
- Mute
- Subscribe to RSS Feed
- Permalink
- Report Inappropriate Content
which ever; are you uploading one of them? 
Andy
- Mark as New
- Bookmark
- Subscribe
- Mute
- Subscribe to RSS Feed
- Permalink
- Report Inappropriate Content
Actually i'm working in Qlik sense.
but whenever i came across difficulty in my apps i put same data in QV and QW for get solution for a sample data.
- Mark as New
- Bookmark
- Subscribe
- Mute
- Subscribe to RSS Feed
- Permalink
- Report Inappropriate Content
OK, please upload either an example qvw OR qvf
Andy
- Mark as New
- Bookmark
- Subscribe
- Mute
- Subscribe to RSS Feed
- Permalink
- Report Inappropriate Content
ok
- Mark as New
- Bookmark
- Subscribe
- Mute
- Subscribe to RSS Feed
- Permalink
- Report Inappropriate Content
Why don't you set the flag color in the load script? Something like:
if(param_value<=-1 and param_value>=-10, 'RED',
if(param_value<=-10.1 and param_value>=-13.9, 'YELLOW',
if(param_value<=-14 and param_value>=-17.9, 'AMBER',
if(param_value<=-20, 'AMBER',
)
)
)
) as param_color;
- « Previous Replies
-
- 1
- 2
- Next Replies »