Unlock a world of possibilities! Login now and discover the exclusive benefits awaiting you.
- Qlik Community
- :
- All Forums
- :
- QlikView App Dev
- :
- KPI's account in P&L Statement
- Subscribe to RSS Feed
- Mark Topic as New
- Mark Topic as Read
- Float this Topic for Current User
- Bookmark
- Subscribe
- Mute
- Printer Friendly Page
- Mark as New
- Bookmark
- Subscribe
- Mute
- Subscribe to RSS Feed
- Permalink
- Report Inappropriate Content
KPI's account in P&L Statement
Hi everyone,
I want to some KPI’s elements calculate dynamically and automatically in my P&L Statement chart. I don’t want to use these elements in Excel Data.
Some KPI’s are;
Net Operating Income = (Revenue - Operating Expenses)
NOI Margin % = (Net Operating Income / Revenue)
Revenue Per Head = (Revenue / Headcount)
How can i add these KPI's in my chart.
Thank you
- Mark as New
- Bookmark
- Subscribe
- Mute
- Subscribe to RSS Feed
- Permalink
- Report Inappropriate Content
Hi Askin,
did you find a solution, I have the same problem ?
The only work around that I have found is to used a pivot table, create a measure for each node of the P&L, switch measures in rows....
it's not very fine and I can't compare easily columns them with each other.
- Mark as New
- Bookmark
- Subscribe
- Mute
- Subscribe to RSS Feed
- Permalink
- Report Inappropriate Content
Dear Benoit,
Unfortunately I could not find.
- Mark as New
- Bookmark
- Subscribe
- Mute
- Subscribe to RSS Feed
- Permalink
- Report Inappropriate Content
![]()
Thanks a lot for your quick reply !!!!.. I have worked with other BI Tools ,less sexy.. like SSAS of Microsoft, but I could handle this point ...
have a nice day.
Regards
Benoît
- Mark as New
- Bookmark
- Subscribe
- Mute
- Subscribe to RSS Feed
- Permalink
- Report Inappropriate Content
I have found this article in the QlikView Library :
https://community.qlik.com/docs/DOC-3324?_ga=1.35745896.979003002.1458557176#start=25
I'll try..
Hi David
I guess you are looking for this solution?
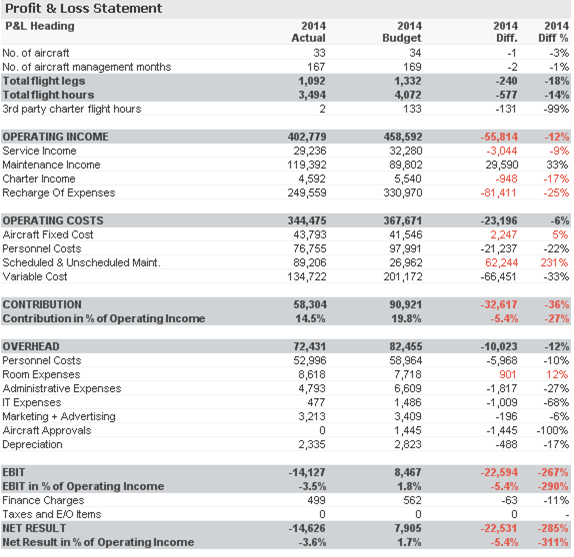
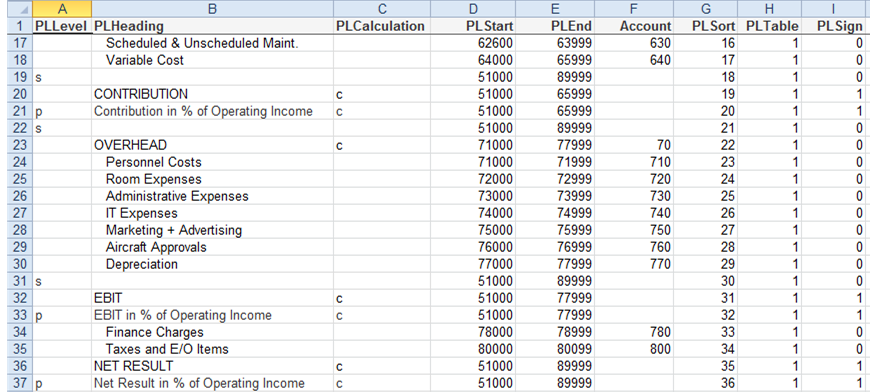
It was fairly easy to achieve. I have amended the Excel table to accommodate for a different row type. So I defined a "p" Level to calculate percentages. I have also added two columns (Table and Sign) to have multiple (different) tables in the same app and the Sign to be able to show the sales as positive value.
The expression then becomes a bit messy, as there are many ifs needed:
=If(PLLevel = 's'
, ''
, If(PLLevel = 'p'
, Num(Sum({$<SourceType={'Actuals'}, AC3=, PeriodStat={'Y'}>} BalanceLC)
/Sum({$<SourceType={'Actuals'}, AC3=, PeriodStat={'Y'}>} If(AC5>='51000' AND AC5<='54999',BalanceLC)), '#,##0.0%')
, If(PLLevel = '1'
, Num(Sum({$<SourceType={'Actuals'}, AC3=, Month={'>=$(vPeriods)'}, PeriodStat={'Y'}>} BalanceLC), '#,##0')
, If(PLLevel = '2'
, Num(Sum({$<SourceType={'Actuals'}, AC3=, Month={'=$(vPeriods)'}, PeriodStat={'Y'}>} BalanceLC), '#,##0')
, If(PLLevel = '3'
, Num(Sum({$<SourceType={'Actuals'}, AC3=, PeriodStat={'Y'}>} BalanceLC), '#,##0')
, If(PLSign = 1
, Num(Sum({$<SourceType={'Actuals'}, AC3=, PeriodStat={'Y'}>} BalanceLC)/1000*-1, '#,##0')
, Num(Sum({$<SourceType={'Actuals'}, AC3=, PeriodStat={'Y'}>} BalanceLC)/1000, '#,##0')
)
)
)
)
)
)
The PLLevel 1 - 3 are again different columns where I show some KPIs that I want to format differently. The PLLevel = P is calculating the percentage of the current subtotal divided by the total sales (AC5 between 51000 and 54999).
To be able to have the KPIs in normal format, the P&L values in 1,000s and the percentages in % I have changed the number formatting to Expression default, but then needed to format every single value here in the expression directly.
One other change I also did was to add a hidden expression with the following values:
Only({1} PLHeading)
With this, the P&L always shows the full structure, even though I might select a department that does not have values on certain lines (an overhead department does not have sales for example). Using the above expression, the P&L will still show all lines and always looks exactly the same.
I'm still not yet 100% happy with it, but it looks already pretty good to.
The above screenshot are actually two tables. The first table only holds the heading and an empty row, but it allows me to have the calculated heading with the Year&'Actual' values. The second table then holds the actual P&L. I separated them, so I can have simpler expression labels (i.e. Actual, Budget, Diff, Diff%) which I then can reuse in the Diff colums to make them much simpler:
=If(PLLevel = 's'
, ''
, If(PLLevel = 'p'
, Num([Actual] - [Budget], '#,##0.0%')
, If(PLSign = 1
, Num([Actual] - [Budget], '#,##0')
, Num([Actual] - [Budget], '#,##0')
)
)
)
Or my color coding looks like this:
=If(PLSign = 1
, If([Diff] < 0, vAlizarin)
, If([Diff] > 0, vAlizarin)
)
(vAlizarin is a variable with the color code red)
I hope this helps somebody else.
- Mark as New
- Bookmark
- Subscribe
- Mute
- Subscribe to RSS Feed
- Permalink
- Report Inappropriate Content
Hi,
I am not exactly Sure i am following what you want?
You can get the required values with the set analysis
=SUM({<[Exec P&L Heading]= {'Revenue'}>}Actual) - SUM({<[Exec P&L Heading]= {'Operating Expenses'}>}Actual)
Do you want this to to show in the table in your example?
You could also achieve it by editing the Excel structure file, but i don't understand why you don't want to do it that way?
Mark
- Mark as New
- Bookmark
- Subscribe
- Mute
- Subscribe to RSS Feed
- Permalink
- Report Inappropriate Content
Mark,
it's little be more tricky,
If I test your proposal like this , (this assumption is to detect the row "Net Operating Income", with the value NOI in the field "Exec P&L Level")
I found "0"
the expression that has used :
num(
if([Exec P&L Level] = 's','',
If([Exec P&L Level] ='NOI',SUM({<[Exec P&L Heading]= {'Revenue'}>}Actual) - SUM({<[Exec P&L Heading]= {'Operating Expenses'}>}Actual)
,Sum([Actual]))
)
,Minstring(Format))
I have tested also the following expression
"SUM({<[Exec P&L Heading]= {'Revenue'}>}Actual) " and I have also edited the ExecProfitLoss excel file with the value 1 forExecPLStart and 50 for ExecPLEnd )

the only formula the following formula , it's working , (
num(
if([Exec P&L Level] = 's','',
If([Exec P&L Level] ='NOI',Sum( if( [Reporting Code] >7 ,[Actual]*-1,[Actual]))
,Sum([Actual]))
)
,Minstring(Format))
conclusion for me, we cannot used "set analysis" custom calculation and ratio must be defined in an harcoded way and handle by a if statement.
in this example, I assumed that Reporting Code >7 are charges, so they must be negative value
regards

