Unlock a world of possibilities! Login now and discover the exclusive benefits awaiting you.
- Qlik Community
- :
- All Forums
- :
- QlikView App Dev
- :
- Re: Legend does not display when only one value in...
- Subscribe to RSS Feed
- Mark Topic as New
- Mark Topic as Read
- Float this Topic for Current User
- Bookmark
- Subscribe
- Mute
- Printer Friendly Page
- Mark as New
- Bookmark
- Subscribe
- Mute
- Subscribe to RSS Feed
- Permalink
- Report Inappropriate Content
Legend does not display when only one value in dimension
I have created a simple self-contained test project to demonstrate this issue.
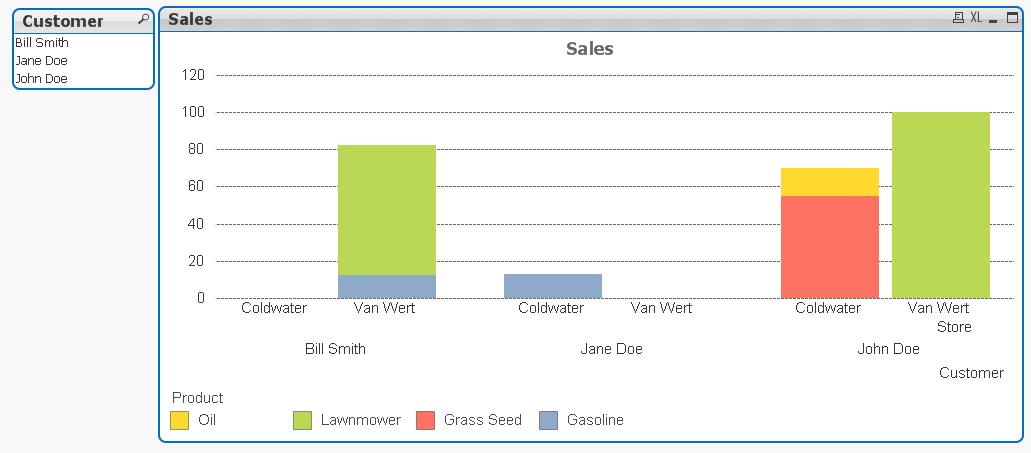
I have a stacked bar chart with 3 dimensions: Customer, Store, and Product. The following picture shows the chart appearing correctly with a legend shown on Product with a different bar segment color for each product shown on the chart.

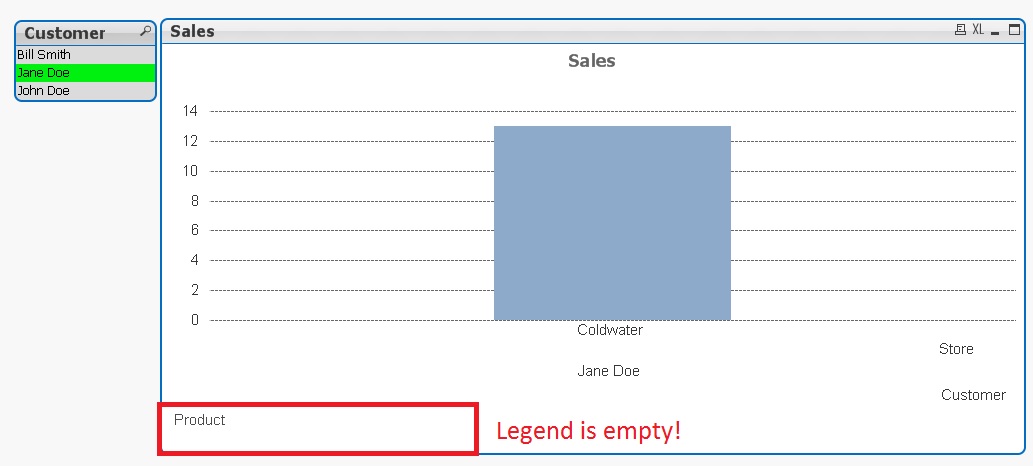
However, when I select the customer 'Jane Doe' there is only one Product value to display. When I do this the Product Legend is empty and I can't tell which product I am looking at because I don't know which product the bar represents. The below picture shows this, with my annotations added in red to highlight the issue.

What makes this even more strange is if I click on the bar chart's caption to make the chart 'active' then the Legend populates showing that blue represents the product 'Gasoline'. However, if I then save the QVW file, the legend again goes blank.
Any ideas on what causes this, and know of any workarounds?
Message was edited by: Jack Diller (attached sample app: MissingLegend.qvw)
- « Previous Replies
-
- 1
- 2
- Next Replies »
Accepted Solutions
- Mark as New
- Bookmark
- Subscribe
- Mute
- Subscribe to RSS Feed
- Permalink
- Report Inappropriate Content
Try now
- Mark as New
- Bookmark
- Subscribe
- Mute
- Subscribe to RSS Feed
- Permalink
- Report Inappropriate Content
Do you have a sample you can share which shows the following behavior?
- Mark as New
- Bookmark
- Subscribe
- Mute
- Subscribe to RSS Feed
- Permalink
- Report Inappropriate Content
Sunny,
I have a sample app, but I don't see how to attach it to the discussion. I see how to attach an image, but not a QVW file. Can you point me in the right direction to do that?
Thanks,
Jack
- Mark as New
- Bookmark
- Subscribe
- Mute
- Subscribe to RSS Feed
- Permalink
- Report Inappropriate Content
Nevermind, I was able to attach the sample app to the original post. I had to use a different browser.
- Mark as New
- Bookmark
- Subscribe
- Mute
- Subscribe to RSS Feed
- Permalink
- Report Inappropriate Content
Try now
- Mark as New
- Bookmark
- Subscribe
- Mute
- Subscribe to RSS Feed
- Permalink
- Report Inappropriate Content
Jack,
The legends are used only if there are multiple dimensions, so that its easy to identify which element responds to which dimension.
When there will be just one dimension in the chart, there will be no legend.
Its a basic Qv functionality.
Hope that helps.
Regards,
Swapneel
- Mark as New
- Bookmark
- Subscribe
- Mute
- Subscribe to RSS Feed
- Permalink
- Report Inappropriate Content
Basically you just need to make the chart bigger by a bit i guess, cause i tried clicking on it and your legend is actually being hidden below, you just have to align the legend maybe to the right or left side.
- Mark as New
- Bookmark
- Subscribe
- Mute
- Subscribe to RSS Feed
- Permalink
- Report Inappropriate Content
Hi Jack,
Simply drag and set your legends using Shift + Ctrl
- Mark as New
- Bookmark
- Subscribe
- Mute
- Subscribe to RSS Feed
- Permalink
- Report Inappropriate Content
just adjust the legends position using Shift + Ctrl.. it will show you what u are expecting...
- Mark as New
- Bookmark
- Subscribe
- Mute
- Subscribe to RSS Feed
- Permalink
- Report Inappropriate Content
Hi ,
- By Using Control+Shift Move your Legend to Right side of the chart
- Then Do your selections You can Have a View of legends OR If you want it at bottom only means you should provide some more space for legend to be displayed down there by dragging .
PFA,
HTH,
Hirish
- « Previous Replies
-
- 1
- 2
- Next Replies »