Unlock a world of possibilities! Login now and discover the exclusive benefits awaiting you.
- Qlik Community
- :
- All Forums
- :
- QlikView App Dev
- :
- Limit Line Chart Aggregation/Accumulation
- Subscribe to RSS Feed
- Mark Topic as New
- Mark Topic as Read
- Float this Topic for Current User
- Bookmark
- Subscribe
- Mute
- Printer Friendly Page
- Mark as New
- Bookmark
- Subscribe
- Mute
- Subscribe to RSS Feed
- Permalink
- Report Inappropriate Content
Limit Line Chart Aggregation/Accumulation
I am trying to use a line chart to show actual orders vs. budget orders accumulated per work day. In order to show the budget numbers through the end of the month I am joining a master calendar. However, I don't want to see actual orders accumulated any further. I've tried using aggregation function, but that works well only on a pivot table, not a line graph.
Here is an example of what I'm doing with order data through July 8th, but selections through July 10th. I don't want the last two order data points on my graph, data is below the graph:
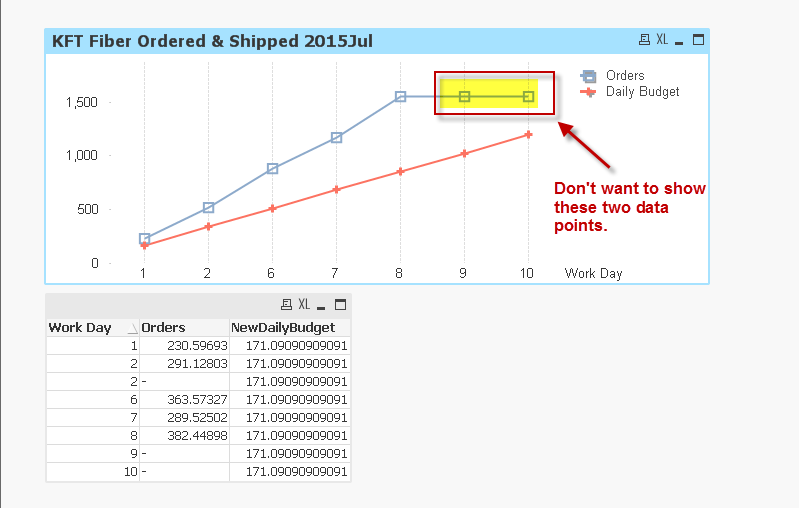
I have "Full Accumulation" selected for the Orders expression, but if I use "No Accumulation" I get only the individual values for that day. I cannot (don't know how to ??) get MTD values in the script using a loop since often I have NULL values for the Orders, and the script fails when trying to evaluate that null - since it gets stored that way in a variable as I'm looping.
Has anyone figured out how to deal with this? Initially I'm just wondering if it can be solved in the designer. If not, then I will try and figure out how to re-configure my data.
Thanks - Dan