Unlock a world of possibilities! Login now and discover the exclusive benefits awaiting you.
- Qlik Community
- :
- All Forums
- :
- QlikView App Dev
- :
- Re: Line chart with two dimensions in one
- Subscribe to RSS Feed
- Mark Topic as New
- Mark Topic as Read
- Float this Topic for Current User
- Bookmark
- Subscribe
- Mute
- Printer Friendly Page
- Mark as New
- Bookmark
- Subscribe
- Mute
- Subscribe to RSS Feed
- Permalink
- Report Inappropriate Content
Line chart with two dimensions in one
Dear All,
I am trying to create a plot similar to the one displayed below, but with two lines. On the x axis, I would like to have one single dimension, representing the time of the day (in hours, from 0 to 23).
The aim of the plot is to show the number of people who arrive to the hospital by hour, and the number of people who leave the hospital by hour. One line for each.
So, should I have one single dimension for both, or separated dimensions?
Any ideas?
Thanks in advance.
Cheers,
Ines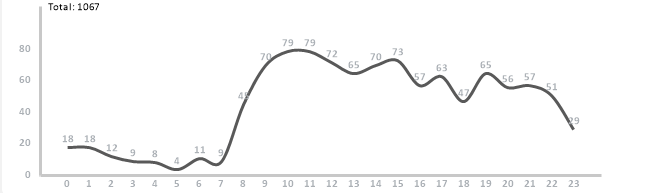
- « Previous Replies
-
- 1
- 2
- Next Replies »
Accepted Solutions
- Mark as New
- Bookmark
- Subscribe
- Mute
- Subscribe to RSS Feed
- Permalink
- Report Inappropriate Content
with two seperate fields I guess you mean arrival and leaving timestamps.
You could solve this by creating a canonical date (or in this case time):
hope this helps
regards
Marco
- Mark as New
- Bookmark
- Subscribe
- Mute
- Subscribe to RSS Feed
- Permalink
- Report Inappropriate Content
I would go for one dimension and two expressions.
- Mark as New
- Bookmark
- Subscribe
- Mute
- Subscribe to RSS Feed
- Permalink
- Report Inappropriate Content
The problem is that I load two separate fields from the fact table. How can I merge them into one and associate the number of people?
- Mark as New
- Bookmark
- Subscribe
- Mute
- Subscribe to RSS Feed
- Permalink
- Report Inappropriate Content
Hi,
If you share some sample data or application then it would be easier to solve. I think for this scenario you can use Hour as dimension and two expressions like
Sum(PatientsArrived)
Sum(PatientsLeft)
Regards,
Jagan.
- Mark as New
- Bookmark
- Subscribe
- Mute
- Subscribe to RSS Feed
- Permalink
- Report Inappropriate Content
with two seperate fields I guess you mean arrival and leaving timestamps.
You could solve this by creating a canonical date (or in this case time):
hope this helps
regards
Marco
- Mark as New
- Bookmark
- Subscribe
- Mute
- Subscribe to RSS Feed
- Permalink
- Report Inappropriate Content
one dimension as hour on ur x-axis
and two expressions
one for number of people who arrive to the hospital by hour
second for number of people who leave the hospital by hour
- Mark as New
- Bookmark
- Subscribe
- Mute
- Subscribe to RSS Feed
- Permalink
- Report Inappropriate Content
Thank you  seems like something I could use. I will try to understand it.
- Mark as New
- Bookmark
- Subscribe
- Mute
- Subscribe to RSS Feed
- Permalink
- Report Inappropriate Content
Sorry, The example I provided was not correct. Here follows the correct one.
- Mark as New
- Bookmark
- Subscribe
- Mute
- Subscribe to RSS Feed
- Permalink
- Report Inappropriate Content
Inês
See Attached.
I did a Binary Load off your qvw to rejig your data model.
- Mark as New
- Bookmark
- Subscribe
- Mute
- Subscribe to RSS Feed
- Permalink
- Report Inappropriate Content
Took me a bit to understand, but it works ! Thank you!
- « Previous Replies
-
- 1
- 2
- Next Replies »