Unlock a world of possibilities! Login now and discover the exclusive benefits awaiting you.
- Qlik Community
- :
- All Forums
- :
- QlikView App Dev
- :
- Re: Line chart
- Subscribe to RSS Feed
- Mark Topic as New
- Mark Topic as Read
- Float this Topic for Current User
- Bookmark
- Subscribe
- Mute
- Printer Friendly Page
- Mark as New
- Bookmark
- Subscribe
- Mute
- Subscribe to RSS Feed
- Permalink
- Report Inappropriate Content
Line chart
Hello Developers
I have a line chart in which i created 4 reference lines that shows the range value. If i select any lab the line chart should display only the reference line that lab has the value range. The other reference lines should not be displayed. Can someone help me please.
Thanks
Anil
Accepted Solutions
- Mark as New
- Bookmark
- Subscribe
- Mute
- Subscribe to RSS Feed
- Permalink
- Report Inappropriate Content
Maybe use a condition that checks the max range value against your reference line value?
- Mark as New
- Bookmark
- Subscribe
- Mute
- Subscribe to RSS Feed
- Permalink
- Report Inappropriate Content
" If i select any lab the line chart should display only the reference line that lab has the value range. "
Sorry, I don't understand this. Could you elaborate further?
In general, you can use the show condition in the reference line properties, but it seems you already discovered this.
- Mark as New
- Bookmark
- Subscribe
- Mute
- Subscribe to RSS Feed
- Permalink
- Report Inappropriate Content
Hi Stefan
Thanks for the reply.
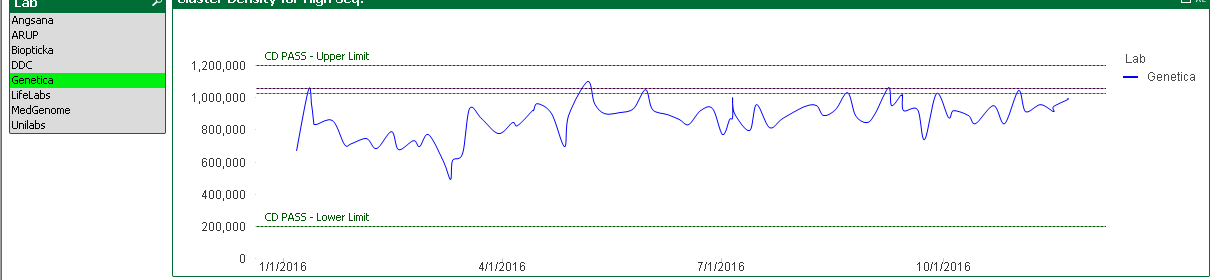
In the below image the CD pass upper limit line should not be displayed. The reference lines should be displayed according to the range of the selected lab.
- Mark as New
- Bookmark
- Subscribe
- Mute
- Subscribe to RSS Feed
- Permalink
- Report Inappropriate Content
In the version you've uploaded, the reference line is not shown, it's only shown for lab 'ARUP'.
edit: You can change the condition to
=SubstringCount( Concat(Distinct Lab,'|'), 'ARUP')
to also show the line when nothing is selected (so whenever ARUP is a possible value in lab value range).
- Mark as New
- Bookmark
- Subscribe
- Mute
- Subscribe to RSS Feed
- Permalink
- Report Inappropriate Content
Yes Stefan. I want these condition should apply for all labs. The reference lines should display only the range for each selected lab.
Thanks
Anil
- Mark as New
- Bookmark
- Subscribe
- Mute
- Subscribe to RSS Feed
- Permalink
- Report Inappropriate Content
Seem I am still missing what is defining these ranges.
- Mark as New
- Bookmark
- Subscribe
- Mute
- Subscribe to RSS Feed
- Permalink
- Report Inappropriate Content
Stefan
In the above screen shot i have selected the lab genetica. There are 4 reference lines in that chart the blue line is not reaching the CD pass limit line as the range value is greater than the range value of that lab. That reference line should not appear in the chart.
Thanks
Anil
- Mark as New
- Bookmark
- Subscribe
- Mute
- Subscribe to RSS Feed
- Permalink
- Report Inappropriate Content
Maybe use a condition that checks the max range value against your reference line value?
- Mark as New
- Bookmark
- Subscribe
- Mute
- Subscribe to RSS Feed
- Permalink
- Report Inappropriate Content
Thanks Stefan 
Thanks
Anil