Unlock a world of possibilities! Login now and discover the exclusive benefits awaiting you.
- Qlik Community
- :
- All Forums
- :
- QlikView App Dev
- :
- Re: List Box Display
- Subscribe to RSS Feed
- Mark Topic as New
- Mark Topic as Read
- Float this Topic for Current User
- Bookmark
- Subscribe
- Mute
- Printer Friendly Page
- Mark as New
- Bookmark
- Subscribe
- Mute
- Subscribe to RSS Feed
- Permalink
- Report Inappropriate Content
List Box Display
Dear QV Experts,
I have two sheets in a QVW document.
User Type: Dollar, Case, Each
In One Sheet, i need to display Dollar, Case
In the second sheet, i need to display, Dollar, Case, Each.
I have list boxes, KPI, charts, etc in both the sheets. Based on the selection, the respective value should display.
If selected Dollar, Sales Value in Dollar displayed.
If Selected Case, Sales Quantity in Case displayed.
Whereas in the second sheet, if selected Each, then in that particular sheet, Sales Quantity in Each should display.
Where in the first sheet, it should display Dollar values.
Above all are working fine as expected.
Problem is for the list boxes which are linked objects is converting to Each in the First sheet too.
Are there any ways or Do i need to remove from Linked Object & keep separate List boxes for both the sheets.
=If(Metrics ='Case',num(Sum({$<Date={">=$(CYStartDate)<=$(vMaxDate)"}>} CustomerCases),'#,##0'),
If(Metrics ='Dollar',num(Sum({$<Date={">=$(CYStartDate)<=$(vMaxDate)"}>} CustomerSales)/1000,'$#,##0'),
If(Metrics ='Each',num(Sum({$<Date={">=$(CYStartDate)<=$(vMaxDate)"}>} CustomerEach)/1000,'#,##0'))))
Please suggest me.
Thanks,
Sasi
- Tags:
- new_to_qlikview
- « Previous Replies
- Next Replies »
Accepted Solutions
- Mark as New
- Bookmark
- Subscribe
- Mute
- Subscribe to RSS Feed
- Permalink
- Report Inappropriate Content
Hi Sunny,
I got it.
In trigger event, i used this,
If(Metrics ='Case','Case', If(Metrics ='Dollar','Dollar', If(Metrics ='Each','Dollar')))
It is working now.
Thanks,
Sasi
- Mark as New
- Bookmark
- Subscribe
- Mute
- Subscribe to RSS Feed
- Permalink
- Report Inappropriate Content
Dear QV Experts,
Please find enclosed the Test Qvw file.
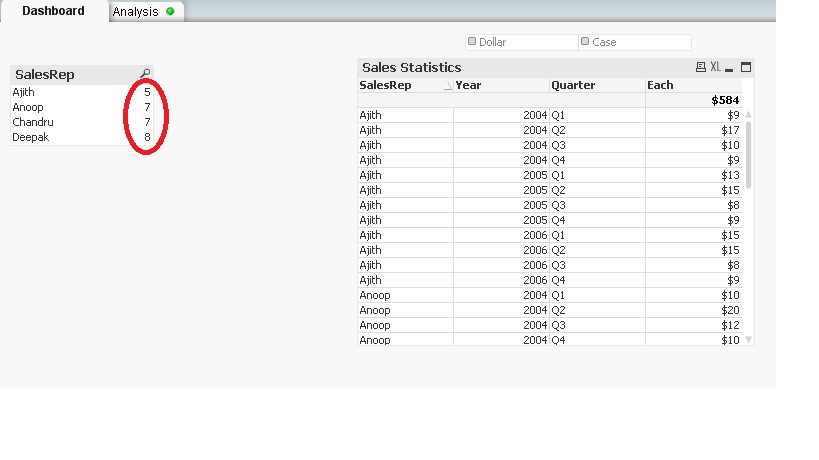
In dashboard Tab, Only Dollar, Case are available. But in Analysis we have Each too.
So if Each selected, like straight table chart, dollar values to be displayed.
But the list box is linked object, so it is displaying Each.
Can anyone suggest me on this.
- Mark as New
- Bookmark
- Subscribe
- Mute
- Subscribe to RSS Feed
- Permalink
- Report Inappropriate Content
You have mentioned in your expression..
see this:
=If(Metrics ='Case',num(Sum(SalesCases),'#,##0'),
If(Metrics ='Dollar',num(Sum(SalesAmt)/1000,'$#,##0'),
If(Metrics ='Each',num(Sum(SalesAmt)/1000,'$#,##0'))))
Here for Dollar and Each...same expression......
QV is doing what you are asking him to do
- Mark as New
- Bookmark
- Subscribe
- Mute
- Subscribe to RSS Feed
- Permalink
- Report Inappropriate Content
Dont Forget to mention, if you are not selecting Dollar & Case, then what should come in expression at Dashboard report
- Mark as New
- Bookmark
- Subscribe
- Mute
- Subscribe to RSS Feed
- Permalink
- Report Inappropriate Content
That is for Straight Table Chart, but not for List Box.
The List Box Expression is,
=If(Metrics ='Case',num(Sum(SalesCases),'#,##0'),
If(Metrics ='Dollar',num(Sum(SalesAmt)/1000,'$#,##0'),
If(Metrics ='Each',num(Sum(SalesEach)/1000,'#,##0'))))
Thanks,
Sasi
- Mark as New
- Bookmark
- Subscribe
- Mute
- Subscribe to RSS Feed
- Permalink
- Report Inappropriate Content
What do you want DashBoard tab to display when you have Each selected on the Analysis tab?
- Mark as New
- Bookmark
- Subscribe
- Mute
- Subscribe to RSS Feed
- Permalink
- Report Inappropriate Content
Hi Sunny,
Dashboard Tab should display in Dollar, if Each selected in Analysis Tab.
Thanks,
Sasi
- Mark as New
- Bookmark
- Subscribe
- Mute
- Subscribe to RSS Feed
- Permalink
- Report Inappropriate Content
may be this?
- Mark as New
- Bookmark
- Subscribe
- Mute
- Subscribe to RSS Feed
- Permalink
- Report Inappropriate Content
But the ListBox should be of Linked Object. Because i have more than 10 list boxes in the Original Dashboard.
Thanks,
Sasi
- Mark as New
- Bookmark
- Subscribe
- Mute
- Subscribe to RSS Feed
- Permalink
- Report Inappropriate Content
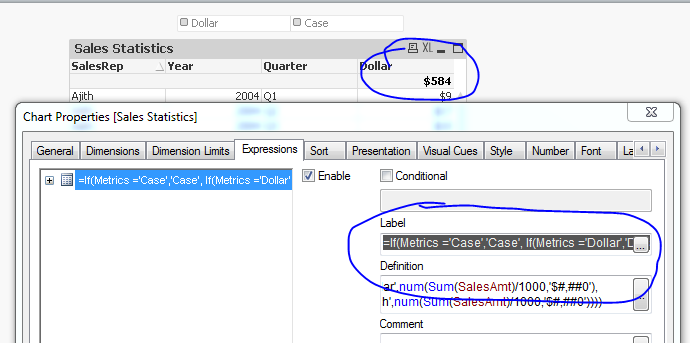
May be this:
Just changed the Expression label since the expression itself was displaying dollar only. New Expression Label -> =If(Metrics ='Case','Case', If(Metrics ='Dollar','Dollar', If(Metrics ='Each','Dollar')))
- « Previous Replies
- Next Replies »