Unlock a world of possibilities! Login now and discover the exclusive benefits awaiting you.
- Qlik Community
- :
- All Forums
- :
- QlikView App Dev
- :
- Re: Log file help
- Subscribe to RSS Feed
- Mark Topic as New
- Mark Topic as Read
- Float this Topic for Current User
- Bookmark
- Subscribe
- Mute
- Printer Friendly Page
- Mark as New
- Bookmark
- Subscribe
- Mute
- Subscribe to RSS Feed
- Permalink
- Report Inappropriate Content
Log file help
Hi Folks,
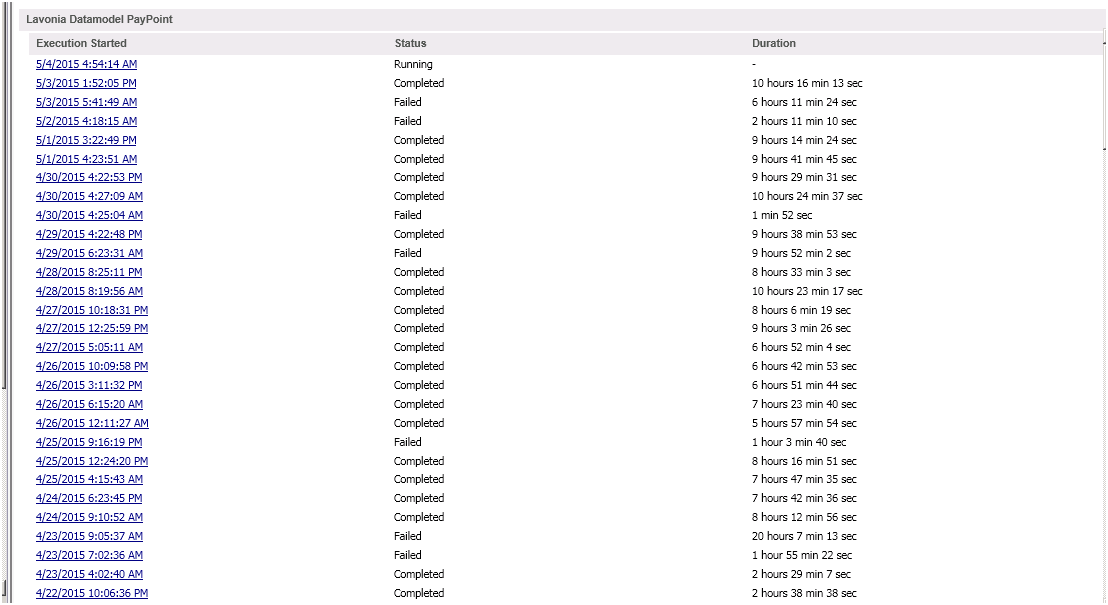
I'm sharing log file of one of my qvw. Usually this take 2 hours to finish the task , but from past 3-4 days it is taking 10-12 hours.
Not sure what could be the reason, please see the log file and suggest.
Thanks,
AS
Accepted Solutions
- Mark as New
- Bookmark
- Subscribe
- Mute
- Subscribe to RSS Feed
- Permalink
- Report Inappropriate Content
Well, you're doing some expensive calculations which may require lots of ram memory. Check the ram usage of your server during the reload. If so much memory is needed that the pagefile is used the server will slow down to a crawl.
The distinct is not necessary if you use aggregations like sum and count and a group by clause. The order by in the second load statement won't do anything useful because of the aggregating/grouping and then joining it to the first load. Loading from a resident table can be slower than loading from a qvd. You can try storing Stichprobe into a qvd and load that qvd instead of doing a resident load. That may or may not make any difference. Testing it will tell.
STORE Stichprobe INTO Stichprobe_Temp.qvd (qvd);
TankCalc_temp:
load distinct
%Tank_Calc_Key,
count(DISTINCT Acquisition_Date) as Fehler,
sum(SCRAP_FLAG) as SCRAP_STATUS
FROM Stichprobe_Temp.qvd (qvd);
where Acquisition_Status_No = 1 and not isnull(Tank_SNr)
group by %Tank_Calc_Key;
join
load distinct
%Tank_Calc_Key,
FirstValue(Acquisition_Date) as Acquisition_Date_Final,
FirstValue(Acquisition_Status_No) as StatMax
FROM Stichprobe_Temp.qvd (qvd);
where not isnull(Tank_SNr)
group by %Tank_Calc_Key
order by Tank_SNr,Acquisition_Date desc
;
talk is cheap, supply exceeds demand
- Mark as New
- Bookmark
- Subscribe
- Mute
- Subscribe to RSS Feed
- Permalink
- Report Inappropriate Content
Check the log file \\TXKAPPHUT003\SourceDocuments\Operation\SCAQ\Lavonia\#App\Datamodel\2_SCAQ_Datenmodell - Lavonia_PayPoint.qvw.log. That log file will show you a timeline of the script execution. That should allow you to pinpoint which parts took up most of the time.
talk is cheap, supply exceeds demand
- Mark as New
- Bookmark
- Subscribe
- Mute
- Subscribe to RSS Feed
- Permalink
- Report Inappropriate Content
Gysbert,
I checked log files . After 2:33 PM next update is 6:27 PM and again after 6:27 PM next was at 11:19 PM
5/3/2015 2:33:42 PM: 0472 TankCalc_temp:
5/3/2015 2:33:42 PM: 0473 load distinct
5/3/2015 2:33:42 PM: 0474
5/3/2015 2:33:42 PM: 0475
5/3/2015 2:33:42 PM: 0476 %Tank_Calc_Key,
5/3/2015 2:33:42 PM: 0477
5/3/2015 2:33:42 PM: 0478 count(DISTINCT Acquisition_Date) as Fehler,
5/3/2015 2:33:42 PM: 0479 sum(SCRAP_FLAG) as SCRAP_STATUS
5/3/2015 2:33:42 PM: 0480 resident Stichprobe
5/3/2015 2:33:42 PM: 0481 where Acquisition_Status_No = 1 and not isnull(Tank_SNr)
5/3/2015 2:33:42 PM: 0482 group by %Tank_Calc_Key
5/3/2015 6:27:16 PM: 3 fields found: %Tank_Calc_Key, Fehler, SCRAP_STATUS, 261,145 lines fetched
5/3/2015 6:27:18 PM: 0483 join
5/3/2015 6:27:18 PM: 0484 load distinct
5/3/2015 6:27:18 PM: 0485
5/3/2015 6:27:18 PM: 0486
5/3/2015 6:27:18 PM: 0487 %Tank_Calc_Key,
5/3/2015 6:27:18 PM: 0488 FirstValue(Acquisition_Date) as Acquisition_Date_Final,
5/3/2015 6:27:18 PM: 0489 FirstValue(Acquisition_Status_No) as StatMax
5/3/2015 6:27:18 PM: 0490
5/3/2015 6:27:18 PM: 0491 resident Stichprobe
5/3/2015 6:27:18 PM: 0492 where not isnull(Tank_SNr)
5/3/2015 6:27:18 PM: 0493 group by %Tank_Calc_Key order by Tank_SNr,Acquisition_Date desc
5/3/2015 11:19:20 PM: 3 fields found: %Tank_Calc_Key, Acquisition_Date_Final, StatMax, 2,200,492 lines fetched
5/3/2015 11:19:31 PM: Joining/Keeping
5/3/2015 11:19:35 PM: 0496 TankCalc:
5/3/2015 11:19:35 PM: 0497
5/3/2015 11:19:35 PM: 0498 LOAD distinct
5/3/2015 11:19:35 PM: 0499
5/3/2015 11:19:35 PM: 0500 %Tank_Calc_Key,
5/3/2015 11:19:35 PM: 0501
5/3/2015 11:19:35 PM: 0502 Acquisition_Date_Final,
5/3/2015 11:19:35 PM: 0503 1 as Tank_Sum,
5/3/2015 11:19:35 PM: 0504 if(isnull(Fehler) or (Fehler > 0 and StatMax = 0) , 1, 0) as OK,
5/3/2015 11:19:35 PM: 0505 if(Fehler > 0 and (StatMax = 1 or isnull(StatMax)) , 1, 0) as NOK,
5/3/2015 11:19:35 PM: 0506 if(isnull(Fehler) or (Fehler > 0 and StatMax = 0) and SCRAP_STATUS < 1, 1, 0) as OK_WS,
5/3/2015 11:19:35 PM: 0507 if(Fehler > 0 and (StatMax = 1 or isnull(StatMax)) and SCRAP_STATUS < 1, 1, 0) as NOK_WS,
5/3/2015 11:19:35 PM: 0508 if(Fehler > 0 and StatMax = 0 , 1, 0) as REW,
5/3/2015 11:19:35 PM: 0509 if(Fehler > 0 and StatMax = 0,Fehler, 0) as REWT,
5/3/2015 11:19:35 PM: 0510 IF(SCRAP_STATUS >0 ,1,0) as SCRP,
5/3/2015 11:19:35 PM: 0511 Fehler,
5/3/2015 11:19:35 PM: 0512 SCRAP_STATUS,
5/3/2015 11:19:35 PM: 0513 StatMax
5/3/2015 11:19:35 PM: 0514 resident TankCalc_temp
5/3/2015 11:19:35 PM: 13 fields found: %Tank_Calc_Key, Acquisition_Date_Final, Tank_Sum, OK, NOK, OK_WS, NOK_WS, REW, REWT, SCRP, Fehler, SCRAP_STATUS, StatMax, 2,200,492 lines fetched
5/3/2015 11:19:38 PM: 0527 drop table TankCalc
Please help me to understand the reason for this.
Thanks,
AS
- Mark as New
- Bookmark
- Subscribe
- Mute
- Subscribe to RSS Feed
- Permalink
- Report Inappropriate Content
Well, you're doing some expensive calculations which may require lots of ram memory. Check the ram usage of your server during the reload. If so much memory is needed that the pagefile is used the server will slow down to a crawl.
The distinct is not necessary if you use aggregations like sum and count and a group by clause. The order by in the second load statement won't do anything useful because of the aggregating/grouping and then joining it to the first load. Loading from a resident table can be slower than loading from a qvd. You can try storing Stichprobe into a qvd and load that qvd instead of doing a resident load. That may or may not make any difference. Testing it will tell.
STORE Stichprobe INTO Stichprobe_Temp.qvd (qvd);
TankCalc_temp:
load distinct
%Tank_Calc_Key,
count(DISTINCT Acquisition_Date) as Fehler,
sum(SCRAP_FLAG) as SCRAP_STATUS
FROM Stichprobe_Temp.qvd (qvd);
where Acquisition_Status_No = 1 and not isnull(Tank_SNr)
group by %Tank_Calc_Key;
join
load distinct
%Tank_Calc_Key,
FirstValue(Acquisition_Date) as Acquisition_Date_Final,
FirstValue(Acquisition_Status_No) as StatMax
FROM Stichprobe_Temp.qvd (qvd);
where not isnull(Tank_SNr)
group by %Tank_Calc_Key
order by Tank_SNr,Acquisition_Date desc
;
talk is cheap, supply exceeds demand
- Mark as New
- Bookmark
- Subscribe
- Mute
- Subscribe to RSS Feed
- Permalink
- Report Inappropriate Content
Thank you so much for your reply , let me check if this is the case.
But one think I don't understand that usually this data model took 2-3 Hours to finish the task but from last week it is taking around 10 Hours.
Thanks,
AS
- Mark as New
- Bookmark
- Subscribe
- Mute
- Subscribe to RSS Feed
- Permalink
- Report Inappropriate Content
Well, if nothing has changed in your script, you'll have to look at the environment. There are two main influencers to check:
- More data is being loaded in your document?
- More memory is being used by QVS (=therefore unavailable to the QVB process) or by other server programs?
The first you can verify by checking the logs from april 22 & 23. The second can be monitored by using Windows instrumentation tools (like Performance Monitor)
- Mark as New
- Bookmark
- Subscribe
- Mute
- Subscribe to RSS Feed
- Permalink
- Report Inappropriate Content
Maybe you could speed up your loads by splitting those statements into several steps:
1. load with where-clause + (optional) store & drop the table
2. load with group by from the 1. qvd (or per resident)
- Marcus