Unlock a world of possibilities! Login now and discover the exclusive benefits awaiting you.
- Qlik Community
- :
- All Forums
- :
- QlikView App Dev
- :
- Re: Losing colour in chart when I add a second exp...
- Subscribe to RSS Feed
- Mark Topic as New
- Mark Topic as Read
- Float this Topic for Current User
- Bookmark
- Subscribe
- Mute
- Printer Friendly Page
- Mark as New
- Bookmark
- Subscribe
- Mute
- Subscribe to RSS Feed
- Permalink
- Report Inappropriate Content
Losing colour in chart when I add a second expression
I have a 2 dimensional combo chart in Qlikview. First dimension is department, second is financial year.
I have an expression to show number of hours worked by department members, this is represented as a grouped bar on the combo chart, so for each dept, we get a coloured bar for each financial year, as expected.
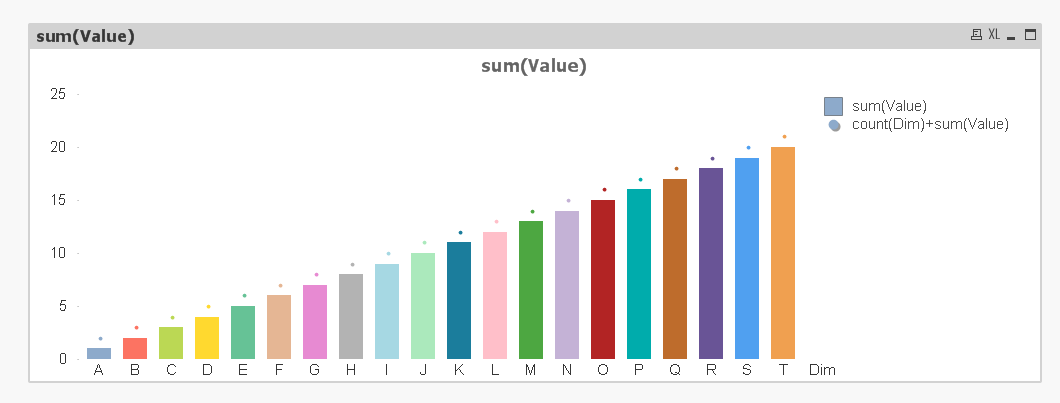
However, when I add in a second expression for a symbol on the chart, the bars all change to blue. this is rather confusing as it no longer matches the colour coding on other charts. This new expression uses AGGR to calculate a single average for each Dimension 1 value (department) rather than doing a separte value for each combination of dept and financial year.
Can anyone suggest a way to keep the colours of Dimension 2 on the first expression when I add this second expression?
Many thanks
Steve
- « Previous Replies
-
- 1
- 2
- Next Replies »
Accepted Solutions
- Mark as New
- Bookmark
- Subscribe
- Mute
- Subscribe to RSS Feed
- Permalink
- Report Inappropriate Content
I have resolved this.
I ended up using a solution along the lines of that suggested by Martin, but using GetFieldSelections rather than Fieldindex.
=Color (((index(GetFieldSelections(Calendar.NexusYear, ',' , 14), Calendar.NexusYear ) -1) /8) +1)
Here, if I have 3 financial years selected (which don't need to be in sequence, The GetFieldSelections function will give me a string like "2008/09,2011/12,2012/13". I then use index to find the position of the financial year I need the colour for and use the remaining addition, subtraction and division to convert the position (1, 9, 17 etc.) to a colour index (1, 2, 3 etc.)
If you're using this, please be aware that if no years are selected, GetFieldSelections returns an empty string. I will need to test GetSelectedCount to check this and if so, use the string "2007/08,2008/09,2009/10......" etc.
Thanks to Nuno, Martin and Nitha, who all planted seeds that allowed me to reach this highly satisfactory solution.
- Mark as New
- Bookmark
- Subscribe
- Mute
- Subscribe to RSS Feed
- Permalink
- Report Inappropriate Content
Hi,
have you already tried going to Properties and in the Color tab check Multicolored?
Kind regards,
Nuno
- Mark as New
- Bookmark
- Subscribe
- Mute
- Subscribe to RSS Feed
- Permalink
- Report Inappropriate Content
Hi Nuno, thanks for rewsponding.
The Multicoloured box is greyed out, and doesn’t respond when I click on it.
Steve
- Mark as New
- Bookmark
- Subscribe
- Mute
- Subscribe to RSS Feed
- Permalink
- Report Inappropriate Content
add
color(FieldIndex('Dim',Dim))
as the background colour of all of your formulas
while Dim is the dimension of your chart.
The only effect ist in the formula legend

Maybe the values are unfortunately, but I used them in another case.
- Mark as New
- Bookmark
- Subscribe
- Mute
- Subscribe to RSS Feed
- Permalink
- Report Inappropriate Content
Then I would set an expression on the "background color" (you can find it when you expand the plus icon on your first expression).
It should be something like this (depending on the years you have):
=if(Financial_Year='2014', color(1), if(Financial_Year='2013', color(2),color(3)))
Hope this helps.
Kind regards,
Nuno
- Mark as New
- Bookmark
- Subscribe
- Mute
- Subscribe to RSS Feed
- Permalink
- Report Inappropriate Content
This is very helpful,, I've used the following expression to get, in this instance, the desired result:
=if ( Calendar.NexusYear ='2013/14', color(1), if(Calendar.NexusYear='2012/13', color(2),color(3)))
This works fine when we have the last 3 financial years selected, but this won't always be the case. However, I'm sure I can define a variable to do the rest of the work or use this in conjuction with Martin's suggestion to get the result I'm after
Many thanks
Steve
- Mark as New
- Bookmark
- Subscribe
- Mute
- Subscribe to RSS Feed
- Permalink
- Report Inappropriate Content
Yes, Martin's suggestion is more progressive.
Glad I could help!
- Mark as New
- Bookmark
- Subscribe
- Mute
- Subscribe to RSS Feed
- Permalink
- Report Inappropriate Content
Thanks Martin, i had a good response from Nuno which has given me a reasonable solution. Your answer seems to have the potential to get the problem sorted without very complex expressions, but I haven't quite got the syntax cracked......
=Color(FieldIndex('Dim',1)) always seems to colour all the bars black, as does =Color(FieldIndex('Dim',Calendar.NexusYear))
Can you provide any extra suggestions on this?
Many thanks
Steve
- Mark as New
- Bookmark
- Subscribe
- Mute
- Subscribe to RSS Feed
- Permalink
- Report Inappropriate Content
fieldindex returns the position value by loading.
this number is used as the color number from the colour tab.
the formula uses the field Dim (without '', = actual Dim in this line) and compares it with 'Dim' (with '', = the column in the table)
hope this helps
- Mark as New
- Bookmark
- Subscribe
- Mute
- Subscribe to RSS Feed
- Permalink
- Report Inappropriate Content
Hi Stephen,
Please try below code in Background color of expression in:
pick(match(Financial_Year, '2013', '2014'),green(), red())
Hope this helps
Nitha
- « Previous Replies
-
- 1
- 2
- Next Replies »