Unlock a world of possibilities! Login now and discover the exclusive benefits awaiting you.
- Qlik Community
- :
- All Forums
- :
- QlikView App Dev
- :
- Re: Market Evolution Index Calculation
- Subscribe to RSS Feed
- Mark Topic as New
- Mark Topic as Read
- Float this Topic for Current User
- Bookmark
- Subscribe
- Mute
- Printer Friendly Page
- Mark as New
- Bookmark
- Subscribe
- Mute
- Subscribe to RSS Feed
- Permalink
- Report Inappropriate Content
Market Evolution Index Calculation
I need to calculate a market evolution index (EI 2014) based on the following data:
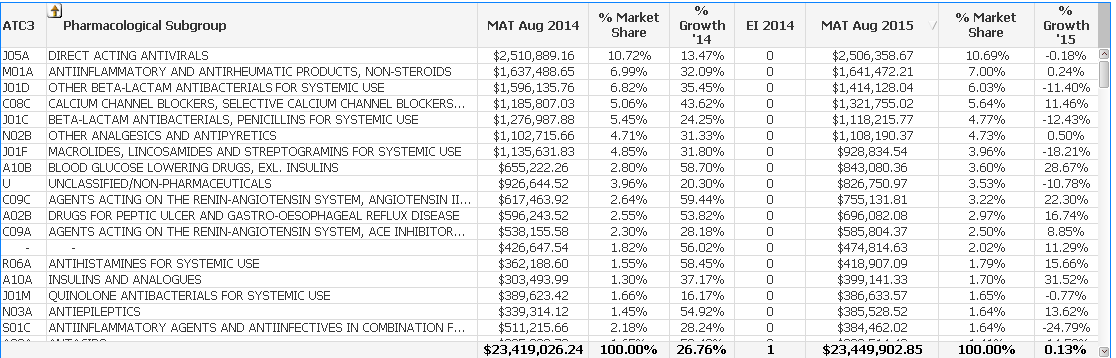
The (EI 2014) for the subgroup "DIRECT ACTING ANTIVIRALS" is calculated as follows:
EI 2014 = (100 + % Growth Rate '14 for the Subgroup) / (100 + Total % Growth Rate '14) * 100 which is
EI 2014 = (100 + 13.47) / (100 +26.76) * 100 = 89
A value under 100 means that the subgroup is growing less than the overall market.
How can i accomplish this with an expression in Qlikview?
- « Previous Replies
-
- 1
- 2
- Next Replies »
- Mark as New
- Bookmark
- Subscribe
- Mute
- Subscribe to RSS Feed
- Permalink
- Report Inappropriate Content
Thanks Manoj
I do not understand your recommendation, can you give me an example expression with the QVW document atttached or just post the expression.
Regards
- Mark as New
- Bookmark
- Subscribe
- Mute
- Subscribe to RSS Feed
- Permalink
- Report Inappropriate Content
You can't use an aggregation function on a column label like that. Use an Aggr() instead:
=Sum({<Year={2013}>} QTY) / Sum({<Year={2012}>} QTY) / Avg(TOTAL Aggr(Sum({<Year={2013}>} QTY) / Sum({<Year={2012}>} QTY), ATCLevelThreeCode))
Your expression simplifies to the above. Leave it as a fraction and format it to display as %.
- Mark as New
- Bookmark
- Subscribe
- Mute
- Subscribe to RSS Feed
- Permalink
- Report Inappropriate Content
find attached sample
- Mark as New
- Bookmark
- Subscribe
- Mute
- Subscribe to RSS Feed
- Permalink
- Report Inappropriate Content
Thank you Jonathan
The Evolution Index is an index number and therefore should not be formatted as a percentage. The Evolution Index was developed primarily to provide better understanding of the relative product/category and market movements over time. It results in 100, if, over a given period the product/category growth is the same as the market growth. A number less than 100 indicates that the product/category is weaker than the market growth, while a number greater than 100 indicates growth stronger than that of the market.
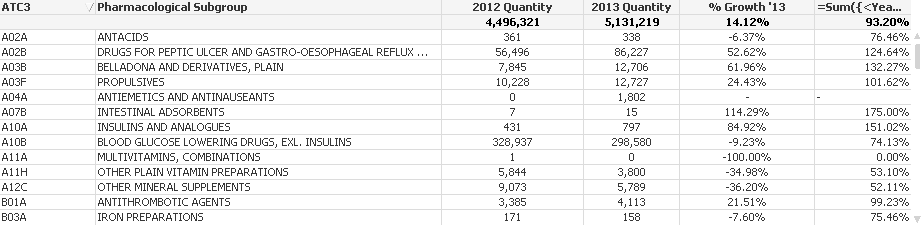
For Antacids the Evolution Index should be :
(100 + (-6.37)) / (100 + 14.12) * 100
= 82
Regards
- Mark as New
- Bookmark
- Subscribe
- Mute
- Subscribe to RSS Feed
- Permalink
- Report Inappropriate Content
Many thanks Manoj
The results from the attached applications give the wrong values.
For example, the Evolution Index for Blood Glucose lowering drugs, excl Insulins should be:
=(100 + (-9.23)) / (100 +14.12) * 100
= 80
as opposed to the figure of 90 shown in the application you recommended. Please se my comments on the Evolution Index above in my reply to Jonathan.
Regards
- Mark as New
- Bookmark
- Subscribe
- Mute
- Subscribe to RSS Feed
- Permalink
- Report Inappropriate Content
find updated qvw
- Mark as New
- Bookmark
- Subscribe
- Mute
- Subscribe to RSS Feed
- Permalink
- Report Inappropriate Content
Manoj
Thank you very much, this revised applications works well.
Regards
- Mark as New
- Bookmark
- Subscribe
- Mute
- Subscribe to RSS Feed
- Permalink
- Report Inappropriate Content
Thanks Anand, most appreciated
- « Previous Replies
-
- 1
- 2
- Next Replies »