Unlock a world of possibilities! Login now and discover the exclusive benefits awaiting you.
- Qlik Community
- :
- All Forums
- :
- QlikView App Dev
- :
- Re: Missing values on time dimension
- Subscribe to RSS Feed
- Mark Topic as New
- Mark Topic as Read
- Float this Topic for Current User
- Bookmark
- Subscribe
- Mute
- Printer Friendly Page
- Mark as New
- Bookmark
- Subscribe
- Mute
- Subscribe to RSS Feed
- Permalink
- Report Inappropriate Content
Missing values on time dimension
Hey,
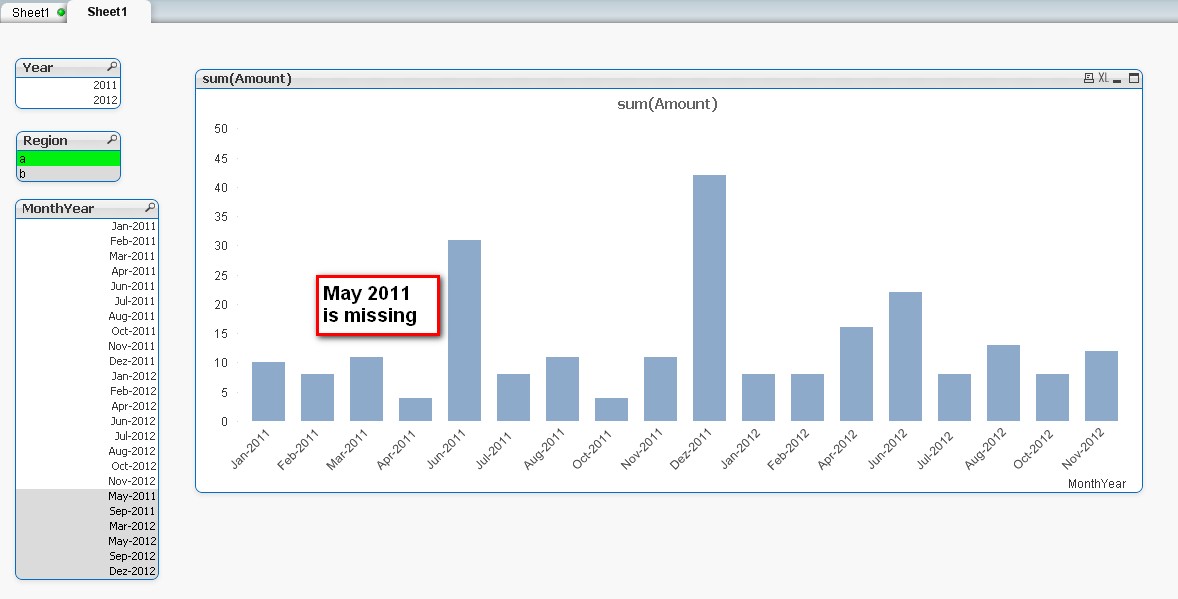
We want to show sales in a bar chart diagram with monthly intervals on the X-axis. Therefore we implemented a master calendar which allows generally to display all months of a year, even when a specific month has no values (having unchecked "Suppress Zero-Values" in the Presentation tab).
Nevertheless, when we select a region which doesn't have values for a certain month, this month isn't shown anymore (e.g. May 2011 for Region "a").

Thank you for your help!
- « Previous Replies
- Next Replies »
- Mark as New
- Bookmark
- Subscribe
- Mute
- Subscribe to RSS Feed
- Permalink
- Report Inappropriate Content
OK, I've tried to simplify as much as possible in the attached example. I've eliminated the "Turn" part since most people will be going by dates most of the time. I now load the Calendar and DateLinks tables first and without any explicit regard to the dates available in my data source, as would be typical in my applications. In the script, I've eliminated all the WHILE loops and variables and iterno() and pick() stuff and tried to stick with the basics. I show the full, resulting Data table with its 'All' keys and the DateLinks table for the selected dates. This is still fundamentally a rather complicated solution to the problem, but hopefully I've eliminated any unnecessary complexity.
- Mark as New
- Bookmark
- Subscribe
- Mute
- Subscribe to RSS Feed
- Permalink
- Report Inappropriate Content
Thanks a lot!!!!!
It is much more familiar
Best regard
Carlo
- Mark as New
- Bookmark
- Subscribe
- Mute
- Subscribe to RSS Feed
- Permalink
- Report Inappropriate Content
I also just added this explanation to the example and reuploaded it:
"To see how it works, take for example the date 1/9/2011. As we can see in the data table, there were no sales for this date. However, our set analysis asks for ShowZeroPoints?='Y'. That maps to a DateKey of either 'All' or 1/9/2011. Even though there's no data for 1/9/2011, there IS data for 'All', but with no sales. That's how we end up with data points at zero for 1/9/2011."
- « Previous Replies
- Next Replies »