Unlock a world of possibilities! Login now and discover the exclusive benefits awaiting you.
- Qlik Community
- :
- All Forums
- :
- QlikView App Dev
- :
- Monochrome effect in Pie/Doughnut chart
- Subscribe to RSS Feed
- Mark Topic as New
- Mark Topic as Read
- Float this Topic for Current User
- Bookmark
- Subscribe
- Mute
- Printer Friendly Page
- Mark as New
- Bookmark
- Subscribe
- Mute
- Subscribe to RSS Feed
- Permalink
- Report Inappropriate Content
Monochrome effect in Pie/Doughnut chart
Dear all,
I was working on different charts to create a monochrome effect. I found this type of charts in the following website- Donut Chart
Please have a look. My question, is it possible to create monochrome effect in Pie/Doughnut chart ? If yes then how ?
I did some work on it. PFA. Same expression worked on Bar chart but not working in Pie chart. Any hep will be appreciated. Thanks in advance.
Regards,
Joy
Accepted Solutions
- Mark as New
- Bookmark
- Subscribe
- Mute
- Subscribe to RSS Feed
- Permalink
- Report Inappropriate Content
Hi,
maybe one solution could be:
RGB(255,
   (1-(Aggr(Sum(#SalesQuantity),@Product_CategoryName) / Max(TOTAL Aggr(Sum(#SalesQuantity),@Product_CategoryName)))) * 128 +127,
   (1-(Aggr(Sum(#SalesQuantity),@Product_CategoryName) / Max(TOTAL Aggr(Sum(#SalesQuantity),@Product_CategoryName)))) * 255)
see also Different shades of blue based on rank
hope this helps
regards
Marco
- Mark as New
- Bookmark
- Subscribe
- Mute
- Subscribe to RSS Feed
- Permalink
- Report Inappropriate Content
Hello all,
Anyone got time to work on it ? Please let me know.
Regards,
Joy
- Mark as New
- Bookmark
- Subscribe
- Mute
- Subscribe to RSS Feed
- Permalink
- Report Inappropriate Content
Hi,
maybe one solution could be:
RGB(255,
   (1-(Aggr(Sum(#SalesQuantity),@Product_CategoryName) / Max(TOTAL Aggr(Sum(#SalesQuantity),@Product_CategoryName)))) * 128 +127,
   (1-(Aggr(Sum(#SalesQuantity),@Product_CategoryName) / Max(TOTAL Aggr(Sum(#SalesQuantity),@Product_CategoryName)))) * 255)
see also Different shades of blue based on rank
hope this helps
regards
Marco
- Mark as New
- Bookmark
- Subscribe
- Mute
- Subscribe to RSS Feed
- Permalink
- Report Inappropriate Content
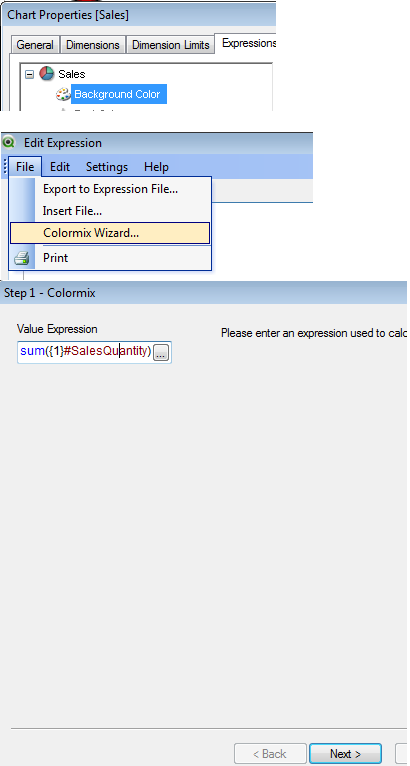
You may also want to Lookup Colormix! In Qlikview!
If a post helps to resolve your issue, please accept it as a Solution.
- Mark as New
- Bookmark
- Subscribe
- Mute
- Subscribe to RSS Feed
- Permalink
- Report Inappropriate Content
Hi @Marco,
This is the solution I was looking for. Thanks for the solution. Its neat and clean and easy to understand. Thanks again.
Regards,
Joy
- Mark as New
- Bookmark
- Subscribe
- Mute
- Subscribe to RSS Feed
- Permalink
- Report Inappropriate Content
you're welcome
glad it worked for you.
regards
Marco
- Mark as New
- Bookmark
- Subscribe
- Mute
- Subscribe to RSS Feed
- Permalink
- Report Inappropriate Content
Hello vinieme12
Can you provide the solution by using lookup Colormix in my app ? It will be helpful to understand the technique...
Regards,
Joy
- Mark as New
- Bookmark
- Subscribe
- Mute
- Subscribe to RSS Feed
- Permalink
- Report Inappropriate Content
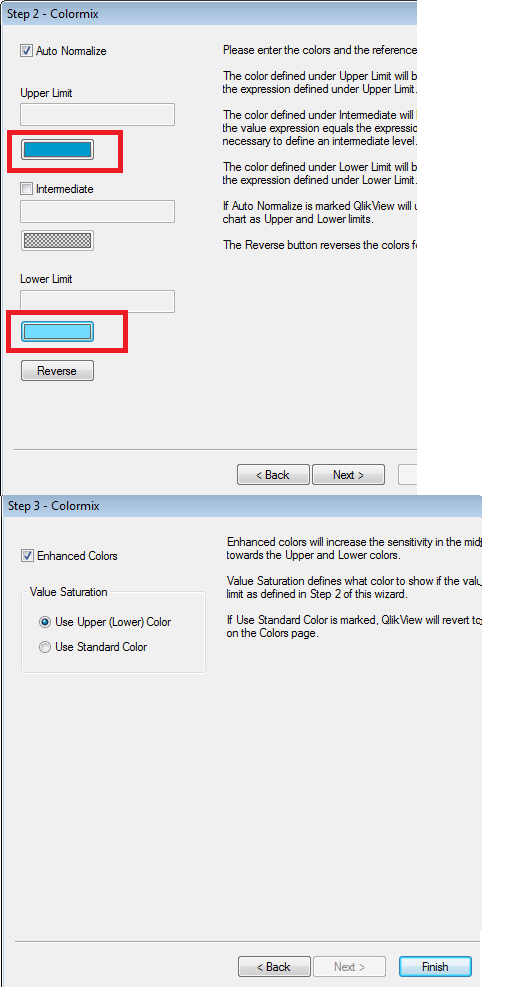
Please see attached, and screenshot of steps, You can also find this on Qlikview Help!
Steps


Colormix will write the expression for you, just click OK and Apply.
Hope this helps
Cheers
V
If a post helps to resolve your issue, please accept it as a Solution.
- Mark as New
- Bookmark
- Subscribe
- Mute
- Subscribe to RSS Feed
- Permalink
- Report Inappropriate Content