Unlock a world of possibilities! Login now and discover the exclusive benefits awaiting you.
- Qlik Community
- :
- All Forums
- :
- QlikView App Dev
- :
- Multiple groups (clusters) in spiderchart?
- Subscribe to RSS Feed
- Mark Topic as New
- Mark Topic as Read
- Float this Topic for Current User
- Bookmark
- Subscribe
- Mute
- Printer Friendly Page
- Mark as New
- Bookmark
- Subscribe
- Mute
- Subscribe to RSS Feed
- Permalink
- Report Inappropriate Content
Multiple groups (clusters) in spiderchart?
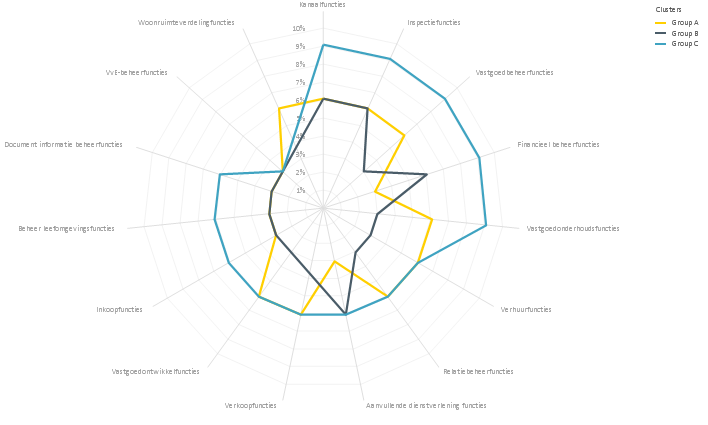
I have a data model that distinguishes organizations by size, e.g. number of employees. In a spiderchart, I want to present the results clusters of the number of employees of organizations: organizations with fewer than 1.000 employees, between 1.000 and 2.000 and more than 2.000 employees.
In a spiderchart, I want to present the average results for each cluster. How do I do this? when I'm not using the clusters, i.e. the total of all organizations, the figure is. When I want to present the results for each cluster, no data is displayed.
Expression used:
if ([Total employees] <= 1000, count ({<[Function supported] = {"Yes"}>} [Function supported]))
/
count (TOTAL <[Specification function - Importance for System]> [Function supported])
See screenshot of figure: now displayed with the total. What I would like to have is a line for each cluster of employees.

- Tags:
- spiderschart
Accepted Solutions
- Mark as New
- Bookmark
- Subscribe
- Mute
- Subscribe to RSS Feed
- Permalink
- Report Inappropriate Content
To debug, put the expression in a list box to see what you get. To test further, change the expression to use Avg() instead of Only():
=Aggr( If(Avg([Total employees])<=1000, 'Group A',
If(Avg([Total employees])<=2000, 'Group B',
'Group C')),
Organization)
Alternatively, you can try the Class function:
=Class( Aggr( Avg([Total employees]), Organization), 1000 )
HIC
- Mark as New
- Bookmark
- Subscribe
- Mute
- Subscribe to RSS Feed
- Permalink
- Report Inappropriate Content
Add a second dimension (Calculated) with
=If([Total employees]<=1000, 'Group A',
If([Total employees]<=2000, 'Group B',
'Group C'))
HIC
- Mark as New
- Bookmark
- Subscribe
- Mute
- Subscribe to RSS Feed
- Permalink
- Report Inappropriate Content
I added a calculated dimension as described above.
=If([Total employees]<=1000, 'Group A',
If([Total employees]<=2000, 'Group B',
'Group C'))
The expression I used is thus:
count ({<[Function supported] = {"Yes"}>} [Function supported]))
/
count (TOTAL <[Specification function - Importance for System]> [Function supported])
Unfortunately, the object only shows results for group C. However, there are also outcomes in group A. They are strangely not shown.
Important thing to mention: I want to show the percentage of 'yes' on a 100% scale, in relation to the number of organizations that has answered 'yes' or 'no' (by function). 'Yes / no' should be excluded.
- Mark as New
- Bookmark
- Subscribe
- Mute
- Subscribe to RSS Feed
- Permalink
- Report Inappropriate Content
OK, then you need to make your calculated dimension a little more complex. You probably have a field "Organization" or something similar, and an Organization can only have one possible number of [Total employees]. If so, try
=Aggr( If(Only([Total employees])<=1000, 'Group A',
If([Total employees]<=2000, 'Group B',
'Group C')),
Organization)
HIC
- Mark as New
- Bookmark
- Subscribe
- Mute
- Subscribe to RSS Feed
- Permalink
- Report Inappropriate Content
Your assumptions are correct. I have a field called 'organization'. I've worked out your idea in the properties of the object ('dimensions'). Still only cluster C is shown, while there are also data (number of employees) in cluster A and B. I have adjusted the ranges (for testing), where:
= Aggr (If (Only ([Total employees]) <= 100000, 'Group A'
If ([Total employees] <= 200000, 'Group B'
"Group C")),
Organization)
Still only results of cluster C is shown (or this might be the outcome of all organizations?). I'm going to try it some more, based on your suggestions. Thanks to far.
- Mark as New
- Bookmark
- Subscribe
- Mute
- Subscribe to RSS Feed
- Permalink
- Report Inappropriate Content
To debug, put the expression in a list box to see what you get. To test further, change the expression to use Avg() instead of Only():
=Aggr( If(Avg([Total employees])<=1000, 'Group A',
If(Avg([Total employees])<=2000, 'Group B',
'Group C')),
Organization)
Alternatively, you can try the Class function:
=Class( Aggr( Avg([Total employees]), Organization), 1000 )
HIC
- Mark as New
- Bookmark
- Subscribe
- Mute
- Subscribe to RSS Feed
- Permalink
- Report Inappropriate Content
Yes! Now I get the results on the screen as I would expect! Thank you Henric Cronström. It worked with the use 'Avg' in de expression.
