Unlock a world of possibilities! Login now and discover the exclusive benefits awaiting you.
- Qlik Community
- :
- All Forums
- :
- QlikView App Dev
- :
- Re: Need bucketting Logic to be created in Calcula...
- Subscribe to RSS Feed
- Mark Topic as New
- Mark Topic as Read
- Float this Topic for Current User
- Bookmark
- Subscribe
- Mute
- Printer Friendly Page
- Mark as New
- Bookmark
- Subscribe
- Mute
- Subscribe to RSS Feed
- Permalink
- Report Inappropriate Content
Need bucketting Logic to be created in Calculated Dimension of Pivot table
Hi
I need little help here. I have below two columns coming from DB. Third column I m creating as (100/percentile) and than I have to bucket it as if col3 <5 then B1 else if col3 > 5 and < 10 than B2 else B3
| Percentile | Band |
| 8 | 0-10 |
| 9 | 0-10 |
| 15 | 10-20 |
| 17 | 10-20 |
| 34 | 30-40 |
| 48 | 40-50 |
| 65 | 60-70 |
| 95 | 90-100 |
n trying to get below table
| Percentile | Band A | Band B | Cal |
| 8 | 0-10 | B3 | 12.5 |
| 9 | 0-10 | B3 | 11.11111 |
| 15 | 10-20 | B2 | 6.666667 |
| 17 | 10-20 | B2 | 5.882353 |
| 34 | 30-40 | B1 | 2.941176 |
| 48 | 40-50 | B2 | 2.083333 |
| 65 | 60-70 | B1 | 1.538462 |
| 95 | 90-100 | B1 | 1.052632 |
I have achieve end result as below mentioned cross tab where we have to show how many value of "Cal' values will fall the intersection of column Band A and Band B
NOTE: I am struggle to create a buckets of B1 B2 B3 in chart pivot table ... this has to be done in chart level only not on script level
cross tab as below table. Values in measure cells indicate the occurrence
| 0-10 | 10-20 | 30-40 | 40-50 | 60-70 | 80-90 | 90-100 | |
| B1 | 1 | 1 | 1 | ||||
| B2 | 2 | 1 | |||||
| B3 | 2 |
Accepted Solutions
- Mark as New
- Bookmark
- Subscribe
- Mute
- Subscribe to RSS Feed
- Permalink
- Report Inappropriate Content
- Mark as New
- Bookmark
- Subscribe
- Mute
- Subscribe to RSS Feed
- Permalink
- Report Inappropriate Content
Hi Madhur,
Please Find the Attached QVW.
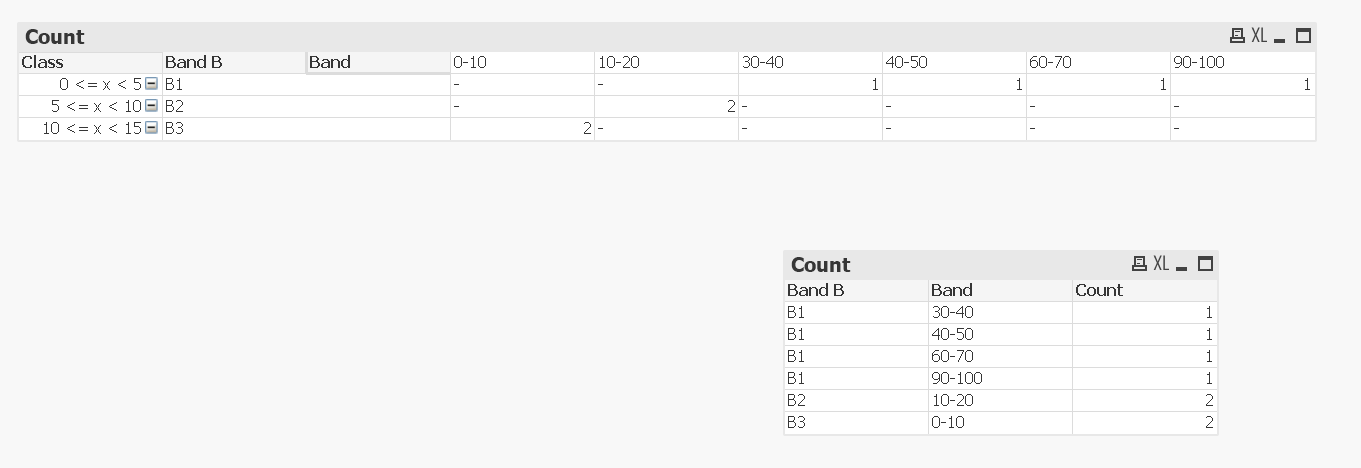
If you want to show in Pivot Table, Then Top Chat will help you, but there is no way to hide the first column in pivot table, Below chart shows the same data pivoted in straight table, you can hide column class.
Hope this will help you solving the problem.
Thanks
Mouna Chandra
- Mark as New
- Bookmark
- Subscribe
- Mute
- Subscribe to RSS Feed
- Permalink
- Report Inappropriate Content
Hi Mouna,
Thanks for th reply. But i dont see any attached QVW here. Could you please attach the same.
Thanks
Madhur
- Mark as New
- Bookmark
- Subscribe
- Mute
- Subscribe to RSS Feed
- Permalink
- Report Inappropriate Content
Hi i am sorry but i am seeing the attachment, Please open the full thread in a separate window, and you will find the attachment.
thanks
mouna chandra
- Mark as New
- Bookmark
- Subscribe
- Mute
- Subscribe to RSS Feed
- Permalink
- Report Inappropriate Content
Hi Mouna,
thanks for the help.
Actually my bad, now i can see the qvw.
The tried to present the issue in a very simple way as this is one part of complex requirement.
Actually the calculation 100/percentile i am calculating through a set analysis formula so the bucketing needs to be done in chart dimension only not in script.
I apologize .. if i am missing something here as i am just 1 few months old in qlikview.
Would be great if you can let me know what how i can bucket the 100/percentile in chart.
- Mark as New
- Bookmark
- Subscribe
- Mute
- Subscribe to RSS Feed
- Permalink
- Report Inappropriate Content
- Mark as New
- Bookmark
- Subscribe
- Mute
- Subscribe to RSS Feed
- Permalink
- Report Inappropriate Content
Thanks Bala For the help. It worked.