Unlock a world of possibilities! Login now and discover the exclusive benefits awaiting you.
- Qlik Community
- :
- All Forums
- :
- QlikView App Dev
- :
- Need help/guidance in optimizing script functional...
- Subscribe to RSS Feed
- Mark Topic as New
- Mark Topic as Read
- Float this Topic for Current User
- Bookmark
- Subscribe
- Mute
- Printer Friendly Page
- Mark as New
- Bookmark
- Subscribe
- Mute
- Subscribe to RSS Feed
- Permalink
- Report Inappropriate Content
Need help/guidance in optimizing script functionality
Hi All,
I need help/guidance in optimizing script included in the attached word document. I have come up with this script in solution to question posted in Arranging table data to formulate start date and end date from different records of same table
The script response is good for a small set of source data but takes long time for a large data set.
I was working on a time line chart related to this data.
Currently there are few known issues to me in the script/chart that I've listed below.
- First (217241) and Last (488058) record in the resulting data set is not getting data
I've attached data source (found on worksheet tab named - "HistDataSource") and resulting data set using the script in (worksheet named - "RestructuredHistData")
I've included chart screen shots for time line chart and resulting data set table. In Time Line I'm using Max [TL Event] that is causing some of repetitive [TL Event] bar to be not displayed (Docs in Negotiation, Inactive)
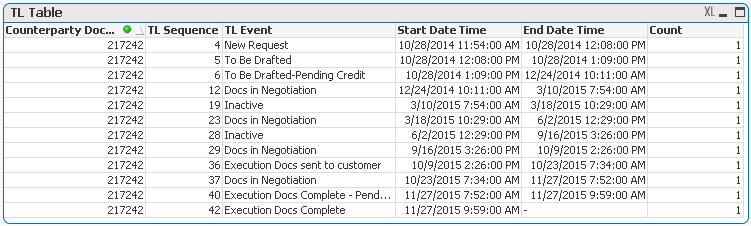
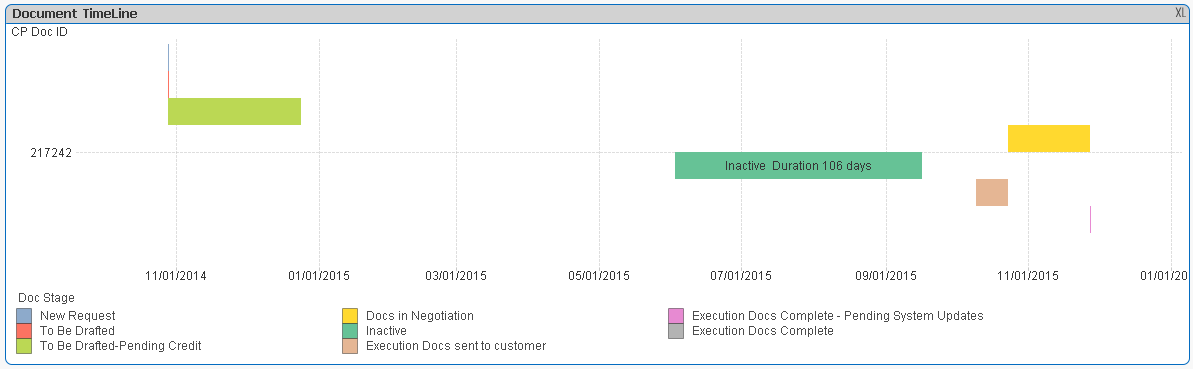
Expression
=Max({<[TL Event]>}[TL End Date Time]) - Max({<[TL Event]>}[TL Start Date Time])
Bar Offset
=Max({<[TL Event]>}[TL Start Date Time])
Thanking in advance.
Best Regards,
Vijay
- Mark as New
- Bookmark
- Subscribe
- Mute
- Subscribe to RSS Feed
- Permalink
- Report Inappropriate Content
I restructured script that helped me with optimization and brought down reload time drastically. I changed the size of table(s) that I was using in FOR ... NEXT loop to few records instead of the large table.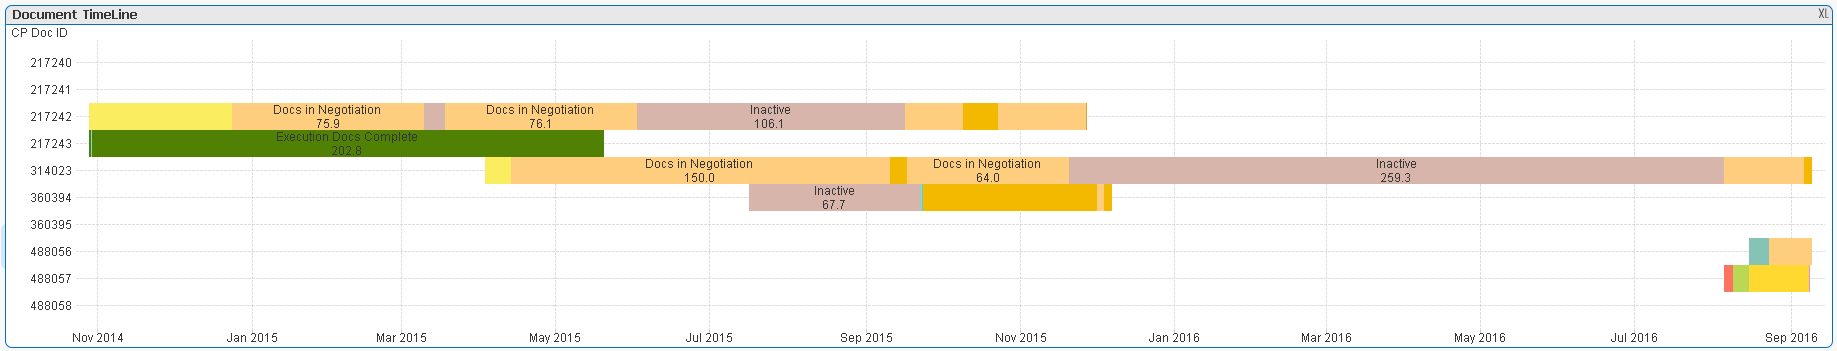
Now I want to get chart to display selected document instead of all documents.
Legends to be shown based on a dimension that is not one of dimension in charts dimension tab.
Chart Dimensions
Counterparty Document: Document ID
TL Sequence
BarExpression
=Num(Max({<[Counterparty Document: Document ID], [TL Sequence]>}[TL End Date Time]) - Min({<[Counterparty Document: Document ID], [TL Sequence]>}[TL Start Date Time]),'#.#')
BarOffset
date(
if(IsNull(above(Only([Counterparty Document: Document ID]))), Min({<[Counterparty Document: Document ID], [TL Sequence]>}[TL Start Date Time]),
RangeMax(0,Min({<[Counterparty Document: Document ID], [TL Sequence]>}[TL Start Date Time])-RangeMax(above(Max({<[Counterparty Document: Document ID], [TL Sequence]>}[TL End Date Time]),1,rowno()-1))))
)
Axes
=Min({<[Counterparty Document: Document ID]>}[TL Start Date Time]) - 5
=Max({<[Counterparty Document: Document ID]>}[TL End Date Time]) + 5