Unlock a world of possibilities! Login now and discover the exclusive benefits awaiting you.
- Qlik Community
- :
- All Forums
- :
- QlikView App Dev
- :
- Re: Newbie question
- Subscribe to RSS Feed
- Mark Topic as New
- Mark Topic as Read
- Float this Topic for Current User
- Bookmark
- Subscribe
- Mute
- Printer Friendly Page
- Mark as New
- Bookmark
- Subscribe
- Mute
- Subscribe to RSS Feed
- Permalink
- Report Inappropriate Content
Newbie question
Hi all
Very new to Qlikview - so wanted to say hello and ask a very basic question, please bear with me!
This is probably the easiest question ever posted, but how do you create a simple aggregated cross table, i.e. one dimension along the top and another down the side and the aggregated sum/count/whatever in the middle!
The pivot table is close, i just need to put one of the variable along the top!
Thanks for you patience!
- Tags:
- new_to_qlikview
Accepted Solutions
- Mark as New
- Bookmark
- Subscribe
- Mute
- Subscribe to RSS Feed
- Permalink
- Report Inappropriate Content
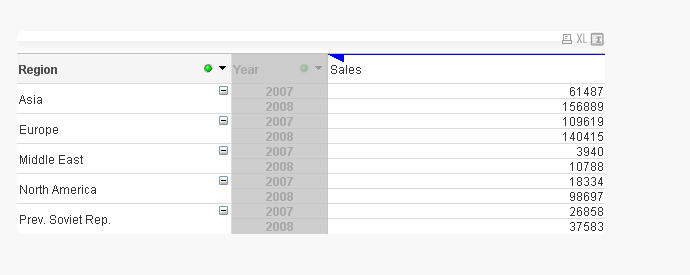
If you create a new chart, select pivot table , add 2 dimensions and an expression. You see what is below,
now drag the 2nd dimension (Year in this case) to the drop zone over the expression (Sales in this case


- Mark as New
- Bookmark
- Subscribe
- Mute
- Subscribe to RSS Feed
- Permalink
- Report Inappropriate Content
If you put your dimension in the pivot table you should be able to try and drag it the columns and pull it to appear across columns instead of in rows.
You will see a blue arrow, you need to make it run horizontally instead of vertically.
- Mark as New
- Bookmark
- Subscribe
- Mute
- Subscribe to RSS Feed
- Permalink
- Report Inappropriate Content
If you create a new chart, select pivot table , add 2 dimensions and an expression. You see what is below,
now drag the 2nd dimension (Year in this case) to the drop zone over the expression (Sales in this case


- Mark as New
- Bookmark
- Subscribe
- Mute
- Subscribe to RSS Feed
- Permalink
- Report Inappropriate Content
Many thanks!! I was clicking around the dimensions thinking that there might be a drag option and then, the blue arrow appeared!!