Unlock a world of possibilities! Login now and discover the exclusive benefits awaiting you.
- Qlik Community
- :
- All Forums
- :
- QlikView App Dev
- :
- Null rows not getting suppressed in Pivot Table
- Subscribe to RSS Feed
- Mark Topic as New
- Mark Topic as Read
- Float this Topic for Current User
- Bookmark
- Subscribe
- Mute
- Printer Friendly Page
- Mark as New
- Bookmark
- Subscribe
- Mute
- Subscribe to RSS Feed
- Permalink
- Report Inappropriate Content
Null rows not getting suppressed in Pivot Table
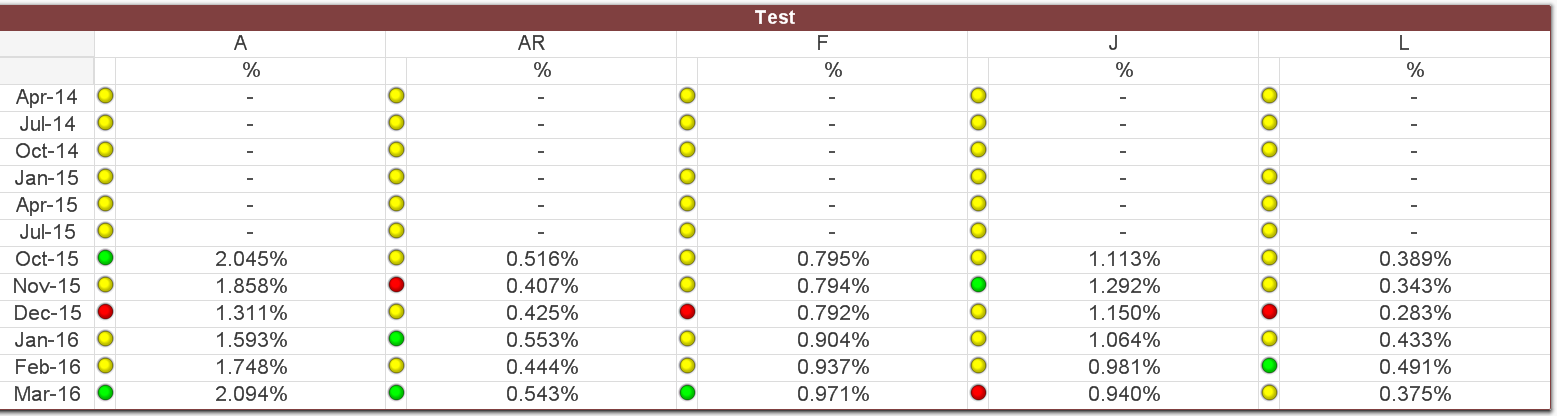
As you can see in the screen, There are some months which have no data in it but are still displayed. I cant delete them in the raw data
as these months have some other associated data with it. How do i hide these months in below pivot table?
I tried using "conditional" in Expressions , Suppress null values checkbox in dimensions (with Trim in edit script) which didn't work for me.
Attaching the Table File + Qlikview file
Accepted Solutions
- Mark as New
- Bookmark
- Subscribe
- Mute
- Subscribe to RSS Feed
- Permalink
- Report Inappropriate Content
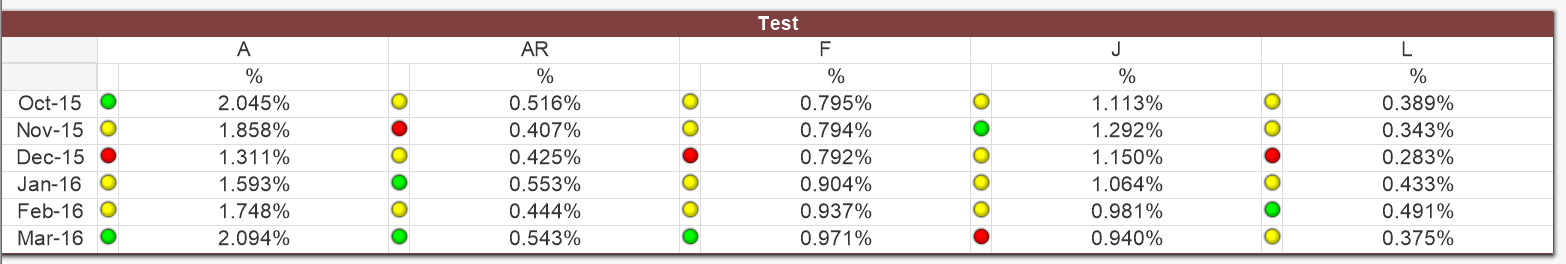
I think you needed to restrict the columns with image in them:
Using Column position - > Column(2)
=If(Len(Trim(Column(2))) > 0,
if(sum([Unique Leads 1 Month])/sum([Active Contacts]) >=
Avg(TOTAL <Brand_Desc> Aggr(If(Rank(sum([Unique Leads 1 Month])/sum([Active Contacts])) <= 3,
sum([Unique Leads 1 Month])/sum([Active Contacts])), Brand_Desc, Month)),
'qmem://<bundled>/BuiltIn/led_g.png',
if(sum([Unique Leads 1 Month])/sum([Active Contacts]) <=
Avg(TOTAL <Brand_Desc> Aggr(If(Rank(-sum([Unique Leads 1 Month])/sum([Active Contacts])) <= 2,
sum([Unique Leads 1 Month])/sum([Active Contacts])), Brand_Desc, Month)),
'qmem://<bundled>/BuiltIn/led_r.png', 'qmem://<bundled>/BuiltIn/led_y.png')))
or
Using Column label - > [%]
=If(Len(Trim([%])) > 0,
if(sum([Unique Leads 1 Month])/sum([Active Contacts]) >=
Avg(TOTAL <Brand_Desc> Aggr(If(Rank(sum([Unique Leads 1 Month])/sum([Active Contacts])) <= 3,
sum([Unique Leads 1 Month])/sum([Active Contacts])), Brand_Desc, Month)),
'qmem://<bundled>/BuiltIn/led_g.png',
if(sum([Unique Leads 1 Month])/sum([Active Contacts]) <=
Avg(TOTAL <Brand_Desc> Aggr(If(Rank(-sum([Unique Leads 1 Month])/sum([Active Contacts])) <= 2,
sum([Unique Leads 1 Month])/sum([Active Contacts])), Brand_Desc, Month)),
'qmem://<bundled>/BuiltIn/led_r.png', 'qmem://<bundled>/BuiltIn/led_y.png')))
- Mark as New
- Bookmark
- Subscribe
- Mute
- Subscribe to RSS Feed
- Permalink
- Report Inappropriate Content
Not at all surprised seeing its you who resolved it so quickly! Thanks once again! 