Unlock a world of possibilities! Login now and discover the exclusive benefits awaiting you.
- Qlik Community
- :
- All Forums
- :
- QlikView App Dev
- :
- Re: Numbering Dimensions on a Chart
- Subscribe to RSS Feed
- Mark Topic as New
- Mark Topic as Read
- Float this Topic for Current User
- Bookmark
- Subscribe
- Mute
- Printer Friendly Page
- Mark as New
- Bookmark
- Subscribe
- Mute
- Subscribe to RSS Feed
- Permalink
- Report Inappropriate Content
Numbering Dimensions on a Chart
We are attempting to prepare a barchart with a large number of dimension values, let's say 200. To simplify this, we are liming the display to the "Top 5" and then show others using the options under Dimension Limits property of the chart. When the user clicks on "Other", they see the next 5. After clicking on other a couple of times, it is hard to remember how far into the list you are. So we would like to number the entire list so you would see the first 5 as 1, 2, 3, ,4, 5. When selecting "Other", you would see 6, 7, 8, 9, 10. And so on as you drilled into the other intil you get to the last screen where you would see 195, 196, 197, 198, 199, 200.
I.e., I would like to generate the handwritten numbers in the following image.
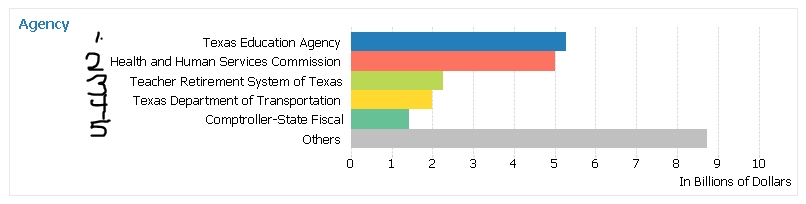
Any thoughts about how to accomplish this will be appreciated.
Accepted Solutions
- Mark as New
- Bookmark
- Subscribe
- Mute
- Subscribe to RSS Feed
- Permalink
- Report Inappropriate Content
Thank you Anjos for putting me on the right track. While it didn’t work quite as needed, it only took a few minutes to get from your idea to where we needed to be. This is the expression that works precisely as intended:
=aggr(rank( sum({$<Dim2=>}Expression1)),Dim2) & ' - ' & Dim2
In this case, we were trying to rank agencies within a particular fiscal year. If I understand Set Analysis, your expression ranked the agencies based on all expenditures loaded.
Thanks again
- Mark as New
- Bookmark
- Subscribe
- Mute
- Subscribe to RSS Feed
- Permalink
- Report Inappropriate Content
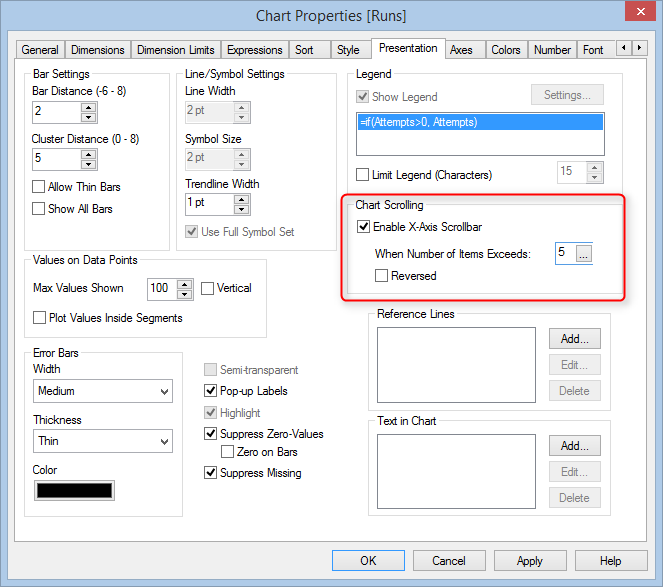
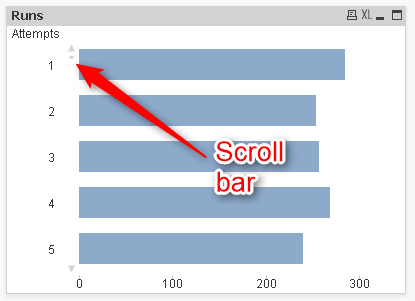
Would it not be better to show the first 5, but then to display a scroll bar?
- Mark as New
- Bookmark
- Subscribe
- Mute
- Subscribe to RSS Feed
- Permalink
- Report Inappropriate Content
Use an Calculated Dimension
=aggr(rank( sum({1}Expression1)),Dim2) & ' - ' & Dim2
where sum({1}Expression1) is your first expression and Dim2 is your Dimension
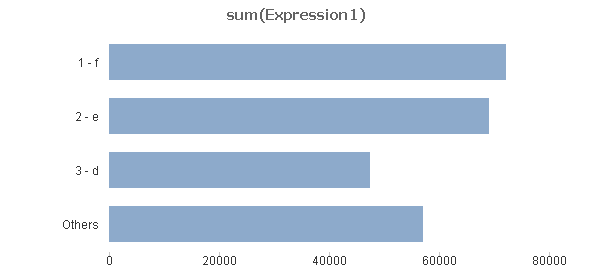
PFA
- Mark as New
- Bookmark
- Subscribe
- Mute
- Subscribe to RSS Feed
- Permalink
- Report Inappropriate Content
Thank you Anjos for putting me on the right track. While it didn’t work quite as needed, it only took a few minutes to get from your idea to where we needed to be. This is the expression that works precisely as intended:
=aggr(rank( sum({$<Dim2=>}Expression1)),Dim2) & ' - ' & Dim2
In this case, we were trying to rank agencies within a particular fiscal year. If I understand Set Analysis, your expression ranked the agencies based on all expenditures loaded.
Thanks again
- Mark as New
- Bookmark
- Subscribe
- Mute
- Subscribe to RSS Feed
- Permalink
- Report Inappropriate Content
Hi, good to know you have resolved
Your expression differs on mine that mine disregards ANY selection and your only Dim2 selections.