Unlock a world of possibilities! Login now and discover the exclusive benefits awaiting you.
- Qlik Community
- :
- All Forums
- :
- QlikView App Dev
- :
- Re: OpenLayers mapping - containter boxes causing ...
- Subscribe to RSS Feed
- Mark Topic as New
- Mark Topic as Read
- Float this Topic for Current User
- Bookmark
- Subscribe
- Mute
- Printer Friendly Page
- Mark as New
- Bookmark
- Subscribe
- Mute
- Subscribe to RSS Feed
- Permalink
- Report Inappropriate Content
OpenLayers mapping - containter boxes causing strange placement of map
Hi all,
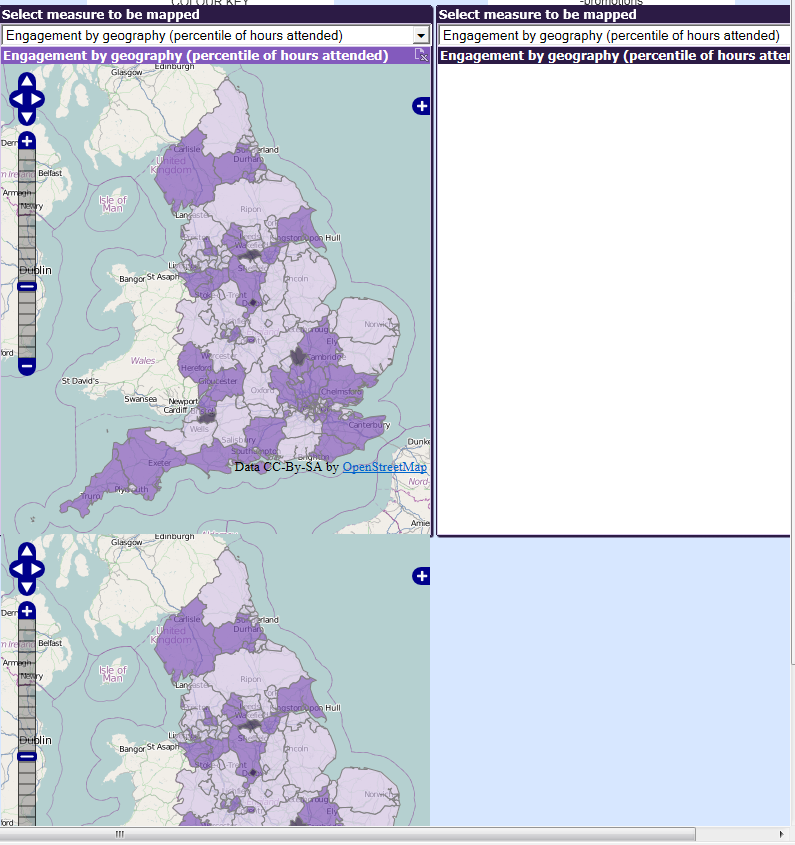
I am mapping some information on a map of the UK and want to compare multiple versions of the mapped info using side by size container boxes. I have this strange occurance that when I try and do this, the immage from the seccond container box sits outside of the container and instead is located benieth the 1st container. The below picture will descibe what I mean. Does anyone know how I can fix this issue? (Please bear in mind my QlikView skills are not yet very advanced - I did not write the code the mapping - this was done by a colleauge).
Many thanks,
Isabel
- « Previous Replies
-
- 1
- 2
- Next Replies »
Accepted Solutions
- Mark as New
- Bookmark
- Subscribe
- Mute
- Subscribe to RSS Feed
- Permalink
- Report Inappropriate Content
I showed it in the 2nd screenshot of the above post.
Listbox with the Expression field.
Variable vExpression containing "=only(Formula)"
Map using $(=vExpression) in the meausre (or Opacity Expression depending on the extension you are using) property.
- Mark as New
- Bookmark
- Subscribe
- Mute
- Subscribe to RSS Feed
- Permalink
- Report Inappropriate Content
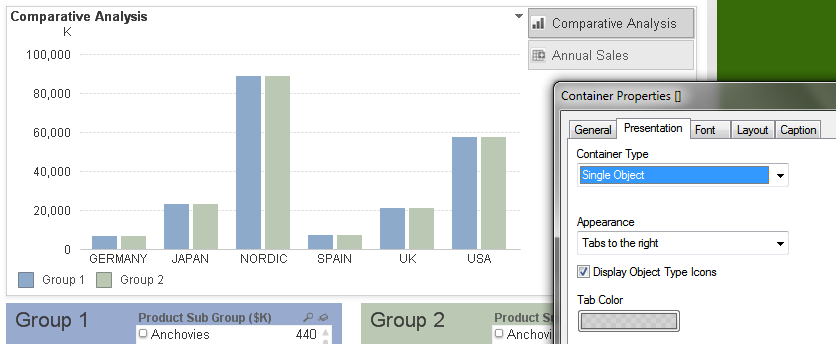
Try to use the tab mode within the container.
If still find rendering issues, don't use the container and place two different objects and some text objects or buttons to show / hide a specific map.
Or, just place the two maps side by side.
If you have many metrics, you can use one map and use a dynamic measure (with a variable) so you won't need many map objects.
- Mark as New
- Bookmark
- Subscribe
- Mute
- Subscribe to RSS Feed
- Permalink
- Report Inappropriate Content
Hi Borja,
There does not seem to be a "Mode" tab in the container box properties. I think that both solutions would work, the first would be easy for me to do, but I would like to get it working with variables. Could you point me to somewhere where I can learn how to create variables?
For this work, I will have a selection of measures under which I will rank 152 areas on England. It is this rank that then determines the collouring. i.e. in the map: if(rank(sum(total<[AREA#]> MEASURE))<=50,rgb(44,27,69), ....
Could you suggest how I set it up such that the measure is a variable?
Thank you,
Isabel
- Mark as New
- Bookmark
- Subscribe
- Mute
- Subscribe to RSS Feed
- Permalink
- Report Inappropriate Content
I'm sorry I wasn't clear about the tab mode.
I was referring to the "Single Object" mode in the Container:
About using variables, you can create/manage document variables using the Variable Overview panel (Ctrl+Alt+V) or in the Variables tab within the Document Properties section.
Create a variable vExpression using:
=only(Expression)
where Expression is the field containing the "label" of the expression and Formula is a field with the associated value to Expression which contains the expression to use in the chart.
Then, in the extension, use:
$(=vExpression)
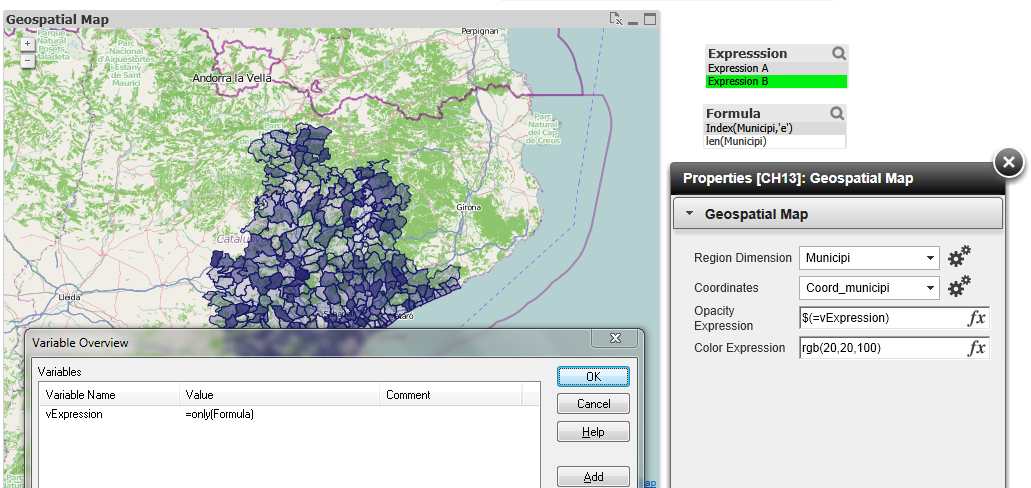
Hope it helps.
- Mark as New
- Bookmark
- Subscribe
- Mute
- Subscribe to RSS Feed
- Permalink
- Report Inappropriate Content
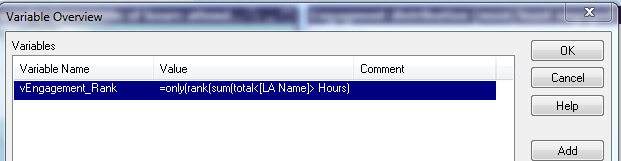
Looked easy, but I am obviously not quite there.... I have set up one variable as shown below in the screen shot, and then in the mapping extension I have written "if($(=vEngagement_Rank)<=50,rgb(44,27,69)..." but this does not seem to register any collours.... I tried taking the "only" out and this gave me a different, quite wrong picture of everything colloured in rather than none or even the correct shading which I have already in the above post .
Any further tips? Also, how will I get the map to change from this variable, to another without creating a new graph?
Thanks for your help,
Isabel
- Mark as New
- Bookmark
- Subscribe
- Mute
- Subscribe to RSS Feed
- Permalink
- Report Inappropriate Content
You are missing one step Isabel, creating the Formula field with the formula.
I created it with an inline table in the script, as follows:
LOAD * INLINE [
Expresssion, Formula
Expression A, "Index(Municipi,'e')"
Expression B, len(Municipi)
];
And the variable vExpression contains
=only(Formula)
You cannot replace your formula inside the ONLY function in the variable because it won't work, it is not the same thing.
Try to replicate the variables table above or, in vExpression use:
=rank(.... Hours)
- Mark as New
- Bookmark
- Subscribe
- Mute
- Subscribe to RSS Feed
- Permalink
- Report Inappropriate Content
I realise that I am taking this as verbatim, but the script looks unhappy:
LOAD
* INLINE [
Expresssion, Formula
Expression_Eng_Rank, rank(sum(total<[LA No]> [Hours])),
Expression_TBC_Count, count(distinct [LA No])
];
- Mark as New
- Bookmark
- Subscribe
- Mute
- Subscribe to RSS Feed
- Permalink
- Report Inappropriate Content
When using Inline tables, enclose the values between double quotes when using special characters:
LOAD * INLINE [
Expresssion, Formula
Expression_Eng_Rank, "rank(sum(total<[LA No]> [Hours]))"
Expression_TBC_Count, "count(distinct [LA No])"
];
Take a look at my inline table:
LOAD * INLINE [
Expresssion, Formula
Expression A, "Index(Municipi,'e')"
Expression B, len(Municipi)
];
- Mark as New
- Bookmark
- Subscribe
- Mute
- Subscribe to RSS Feed
- Permalink
- Report Inappropriate Content
Yes, I tried this too, but it still does not accept it in the script. Maybe the script is unable to do the formula I am using (?) but I know the formula works properly in the orignical chart which seems strange to me.
LOAD
* INLINE [
Expresssion, Formula
Expression_Eng_Rank, "rank(sum(total<[LA No]> [Hours]))"
Expression_TBC_Count, "count(distinct [LA No])"
];
- Mark as New
- Bookmark
- Subscribe
- Mute
- Subscribe to RSS Feed
- Permalink
- Report Inappropriate Content
I see. I tried it and also get the error too, due to the [] characters I think.
Ok, different approach, try to load from an xls file (or csv, etc.). Like the attached file.
- « Previous Replies
-
- 1
- 2
- Next Replies »