Unlock a world of possibilities! Login now and discover the exclusive benefits awaiting you.
Announcements
See why Qlik was named a Leader in the 2025 Gartner® Magic Quadrant™ for Augmented Data Quality Solutions: GET THE REPORT
- Qlik Community
- :
- All Forums
- :
- QlikView App Dev
- :
- Re: Pareto Chart
Options
- Subscribe to RSS Feed
- Mark Topic as New
- Mark Topic as Read
- Float this Topic for Current User
- Bookmark
- Subscribe
- Mute
- Printer Friendly Page
Contributor II
2020-02-06
12:26 PM
- Mark as New
- Bookmark
- Subscribe
- Mute
- Subscribe to RSS Feed
- Permalink
- Report Inappropriate Content
Pareto Chart
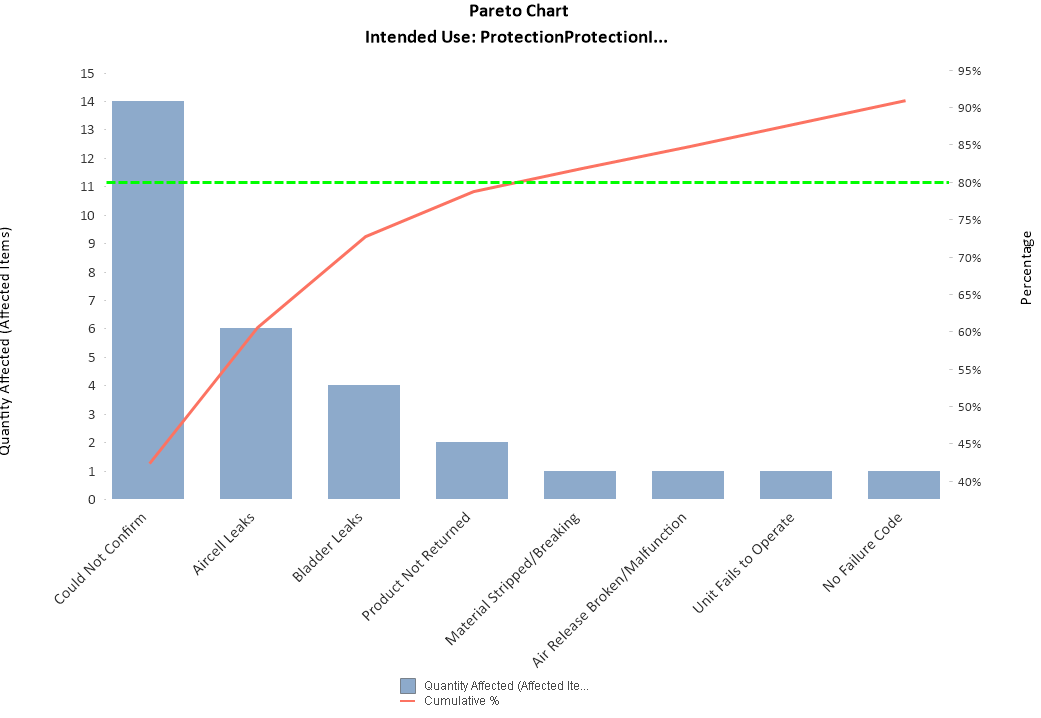
I have a pareto chart in my application (see attached). Some of the dimension values are Null. When I suppress NUll values I don't see the 100% on the Cumulative Line chart. But I show Null values then I can see the cumulative % values until 100%. How do I show 20 - 100% all values and not count Null dimension values for the chart?
7,191 Views
- « Previous Replies
- Next Replies »
34 Replies
MVP
2020-02-12
12:39 PM
- Mark as New
- Bookmark
- Subscribe
- Mute
- Subscribe to RSS Feed
- Permalink
- Report Inappropriate Content
I can't really tell much by looking at images. Also, QlikView doesn't really allow me to load data from image files.
1,211 Views
Contributor II
2020-02-14
02:29 PM
Author
- Mark as New
- Bookmark
- Subscribe
- Mute
- Subscribe to RSS Feed
- Permalink
- Report Inappropriate Content
Sunny - I have attached a sample data model and sample data (data from tables in different sheets).
Every complaint is attached to a part and has a reason and reason detail. One row can only have one reason but multiple reason details separated by ;
Pareto by Reason works fine but the issue is on the pareto by reason detail. On the data model you will see Reason Details table which is one per row. So if a complaint/part row has 3 reason details then this table will contain 3 rows with the same pid and values for the reason details. When I do pareto by reason detail the sum Total does not work. Looks like it only shows the total by Reason. Would the data model and sample data help you identify what's causing this.
I am really stuck here since I am not sure if it is a problem with the data model or just some tweaks needed on the expressions. Any help would be appreciated. Thanks
1,199 Views
Contributor II
2020-02-18
10:42 AM
Author
- Mark as New
- Bookmark
- Subscribe
- Mute
- Subscribe to RSS Feed
- Permalink
- Report Inappropriate Content
I have a pareto chart (bar chart for sum(qty) by one dimension and line chart for cumulative %). I need to show bars with their respective dimension values until 80% and then a sharp spike from 80% to 100% with one last bar showing "Others" as dimension value for the bar.
I don't know if it is possible to use the cumulative % expression itself within the calculated dimension. Any thoughts please.
1,180 Views
Former Employee
2020-03-04
05:25 PM
- Mark as New
- Bookmark
- Subscribe
- Mute
- Subscribe to RSS Feed
- Permalink
- Report Inappropriate Content
Have a look at the following Design Blog post, I believe it may be very helpful to you, there is are a couple additional links at the bottom of this one to two other posts, just FYI, hopefully one of these will get you what you are missing.
https://community.qlik.com/t5/Qlik-Design-Blog/Recipe-for-a-Pareto-Analysis/ba-p/1468497
Regards,
Brett
To help users find verified answers, please do not forget to use the "Accept as Solution" button on any post(s) that helped you resolve your problem or question.
I now work a compressed schedule, Tuesday, Wednesday and Thursday, so those will be the days I will reply to any follow-up posts.
I now work a compressed schedule, Tuesday, Wednesday and Thursday, so those will be the days I will reply to any follow-up posts.
1,150 Views
Contributor II
2020-03-05
12:02 PM
Author
- Mark as New
- Bookmark
- Subscribe
- Mute
- Subscribe to RSS Feed
- Permalink
- Report Inappropriate Content
Thank you for responding. But I did look at those posts already and still can't figure out a way to use calculated dimension based on the cumulative %. Thanks again..
1,138 Views
- « Previous Replies
- Next Replies »
Community Browser