Unlock a world of possibilities! Login now and discover the exclusive benefits awaiting you.
- Qlik Community
- :
- All Forums
- :
- QlikView App Dev
- :
- Peek on first line (Even if Null)
- Subscribe to RSS Feed
- Mark Topic as New
- Mark Topic as Read
- Float this Topic for Current User
- Bookmark
- Subscribe
- Mute
- Printer Friendly Page
- Mark as New
- Bookmark
- Subscribe
- Mute
- Subscribe to RSS Feed
- Permalink
- Report Inappropriate Content
Peek on first line (Even if Null)
Hi all,
Thanks for looking and helping with this challenge,
I've been trying to get a Peek expression to place the first result on the first line with no success,
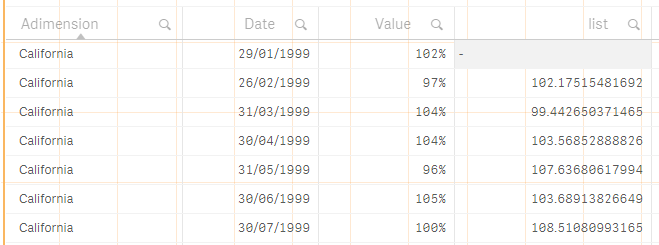
Essentially, with the attached data set I've added in the load script the following line ->
Peek(Value) * If(ISNULL(Peek(list)), 100, (Peek(list))) as list
Which creates exactly what I want (Essentially a workaround for the lack of Excel function Product) however the part I can't figure out is how to get the first Peek result on the first line, so for example

I need the 102.1751 below the null to be on the line above it next to 102% and the same for all the rest?
Any ideas please?
Many thanks
- « Previous Replies
-
- 1
- 2
- Next Replies »
- Mark as New
- Bookmark
- Subscribe
- Mute
- Subscribe to RSS Feed
- Permalink
- Report Inappropriate Content
I don't really have the data to try this out... but may be you need this
Below(TOTAL Sum(list))
or
Below(Sum(list))
- Mark as New
- Bookmark
- Subscribe
- Mute
- Subscribe to RSS Feed
- Permalink
- Report Inappropriate Content
I attached some data to the original post if that helps, but I'll give that a go now, cheers
- Mark as New
- Bookmark
- Subscribe
- Mute
- Subscribe to RSS Feed
- Permalink
- Report Inappropriate Content
This works with just one unfortunate flaw, because the Peek is one row down, it means the latest date is therefore missing when you use Below to shuffle them one row back up.
- Mark as New
- Bookmark
- Subscribe
- Mute
- Subscribe to RSS Feed
- Permalink
- Report Inappropriate Content
What would you want to see for the latest date? I am confused regarding the required output
- Mark as New
- Bookmark
- Subscribe
- Mute
- Subscribe to RSS Feed
- Permalink
- Report Inappropriate Content
Hi Sunny,
Appreciate the need for clarification, so please see attached,
This will show you how its worked out in Excel, unfortunatly I don't have Product function in Qlik (As much as that would solve near enough all my questions) so I've had to work around that in a variety of ways.
In the price column you'll see that March should be 224.67, and next to it on the right (and below) the sums I'm working towards building once these calculations are complete.
Hope this helps?
Many thanks
Ryan
- Mark as New
- Bookmark
- Subscribe
- Mute
- Subscribe to RSS Feed
- Permalink
- Report Inappropriate Content
Try this script may be
Table:
LOAD F2 as Date,
"Monthly return"
FROM [lib://Lib/Copy of Book2.xlsx]
(ooxml, embedded labels, table is Sheet1);
FinalTable:
LOAD *,
1 + [Monthly return] as [1+MR],
Alt(Peek('Price') * (1 + [Monthly return]), 100) as Price
Resident Table
Order By Date;
DROP Table Table;
- « Previous Replies
-
- 1
- 2
- Next Replies »