Unlock a world of possibilities! Login now and discover the exclusive benefits awaiting you.
- Qlik Community
- :
- All Forums
- :
- QlikView App Dev
- :
- Percent Totals for Grids
- Subscribe to RSS Feed
- Mark Topic as New
- Mark Topic as Read
- Float this Topic for Current User
- Bookmark
- Subscribe
- Mute
- Printer Friendly Page
- Mark as New
- Bookmark
- Subscribe
- Mute
- Subscribe to RSS Feed
- Permalink
- Report Inappropriate Content
Percent Totals for Grids
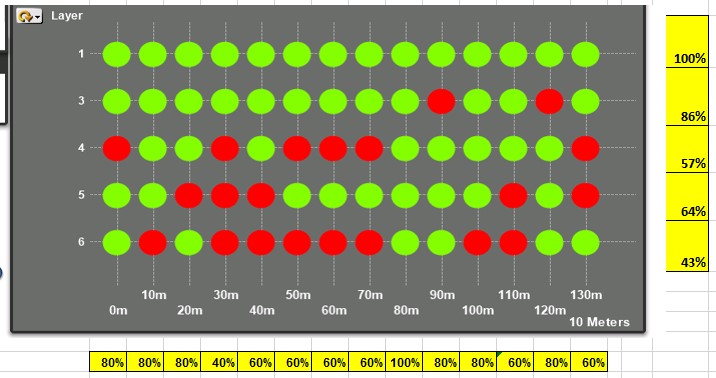
Hi I have Grid chart as shown below where the average temperature of a process is being recorded for every layer (1 to 6) and every 10m (0 to 130m). To achieve this the average value (Avg($(vFieldChart1Ring1)) is calculated by Layer (Y) and distance (X) , in this case the distance is every 10m, but I also group the data into 250mm, 500mm & 1m.

What I would like to do is show the total percentages as highlighted in Yellow above both both Layers and distance.
To achieve the Red and Green Colours I have an expression under the background colours where the average value is compared to variables representing upper and lower limits.
vGridR1LCL = Lower Limit
vGridR1UCL = Upper Limit
=if(avg($(vFieldChart1Ring1))>= vGridR1LCL, if(avg($(vFieldChart1Ring1))<= vGridR1UCL, RGB(128,255,0),RGB(255,0,0)),RGB(255,0,0)) // Green Red, Red
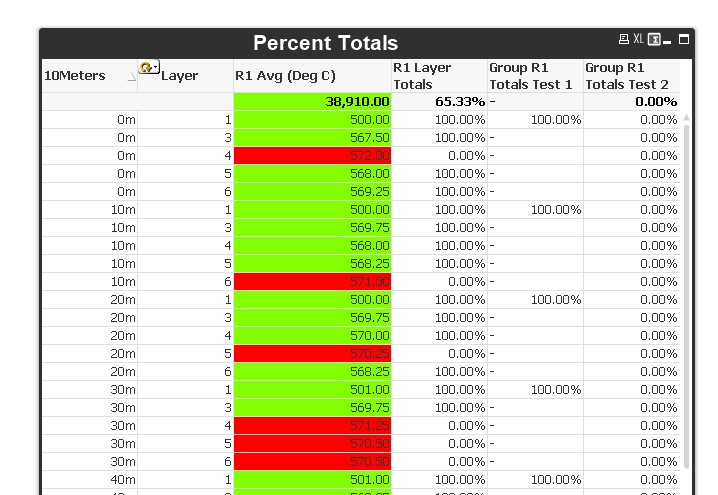
I Have then used the same expression on a Straight Table but replaced the Green with 1 and the Red with 0 to display 100% or 0% against every dot.
=if(avg($(vFieldChart1Ring1))>= vGridR1LCL, if(avg($(vFieldChart1Ring1))<= vGridR1UCL, 1,0),0).
My problem comes when I try to group the data by both X & Y (Distance & Layer) to show the percentage total’s as highlighted in Yellow.
I’ve tried using the “Aggr” function to group the data and show the results
Group R1 Test Totals Test 1:- This just give 100% for every distance group.
=Aggr(if(avg($(vFieldChart1Ring1))>= vGridR1LCL, if(avg($(vFieldChart1Ring1))<= vGridR1UCL, 1,0),0),([XPosition R1 10m]/1000))
Group R1 Test Totals Test 2:- This just give 100% for every distance group.
=Sum(AGGr(if(avg($(vFieldChart1Ring1))>= vGridR1LCL, if(avg($(vFieldChart1Ring1))<= vGridR1UCL, 1,0),0),([XPosition R1 10m]/1000),[R1 Layer]))

Any help would be appreciated.
Thanks
Mark
Accepted Solutions
- Mark as New
- Bookmark
- Subscribe
- Mute
- Subscribe to RSS Feed
- Permalink
- Report Inappropriate Content
If any one is interested here is the answer to having the total percentages in the horizontal line. Works fine except it takes a long time to calculate.
aggr(sum(aggr(if(avg($(vFieldChart1Ring1))>= vGridR1LCL, if(avg($(vFieldChart1Ring1))<= vGridR1UCL, 1,0),0), ($(vGridXpos1)),($(vGridXpos2)))), ($(vGridXpos1))) / Aggr(Count(DISTINCT ($(vGridXpos2)) ), ($(vGridXpos1)))
// vGridXpos1 = Allocates a number based apon Dist Group and Ring 1 or Ring 2 using the Match command
// vGridXpos2 = Determine's the field in the Cylic Group Layer or Layer and Pass for Ring 1 or Ring 2