Unlock a world of possibilities! Login now and discover the exclusive benefits awaiting you.
- Qlik Community
- :
- All Forums
- :
- QlikView App Dev
- :
- Re: Percent of Group Average Accross Periods
- Subscribe to RSS Feed
- Mark Topic as New
- Mark Topic as Read
- Float this Topic for Current User
- Bookmark
- Subscribe
- Mute
- Printer Friendly Page
- Mark as New
- Bookmark
- Subscribe
- Mute
- Subscribe to RSS Feed
- Permalink
- Report Inappropriate Content
Percent of Group Average Accross Periods
Hi,
I am trying to compare individual performance to their group's average performance across periods.
I have the following formulas:
1. Metric: sum(Metric)
2. Group Average:
if(Metric > 0,
Sum({$<Individual= >} TOTAL <Group,Period> Metric)/
COUNT({$<Individual= >} TOTAL <Group,Period> Metric)
)
These work as intended in a straight table. I can either have both an individual and their group selected, or just the individual and the Group Average still works
| Group | Period | Individual | Metric | Group Average |
| 131 | ||||
| b | 0 | n | 68 | 67.5 |
| b | 1 | n | 63 | 61 |
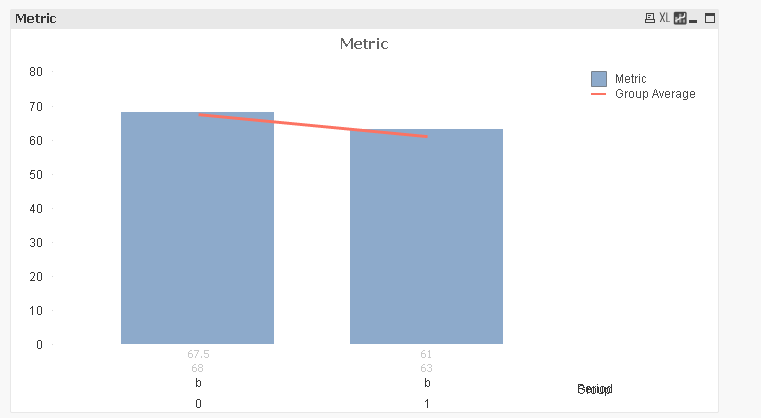
However, when I change this table to a graph, if I select an individual and leave the group selection at the default, it shows the average across all groups (~36) instead of just that individual's group's average.
I have attached my document for reference.
My real data has about 5 groups, and the periods most often used will be weeks.
Thank you,
Elin
- « Previous Replies
-
- 1
- 2
- Next Replies »
Accepted Solutions
- Mark as New
- Bookmark
- Subscribe
- Mute
- Subscribe to RSS Feed
- Permalink
- Report Inappropriate Content
if you do not want to use a combo chart you can use the following expression
| sum({<Group = P({<Individual={"$(=(GetFieldSelections(Individual)))"} >}),Individual=,Metric= {">$(=(0))"}>} TOTAL <Group,Period> Metric) | |
| / | |
| COUNT({<Group = P({<Individual={"$(=(GetFieldSelections(Individual)))"} >}),Individual=,Metric= {">$(=(0))"}>} TOTAL <Group,Period> Metric) |
- Mark as New
- Bookmark
- Subscribe
- Mute
- Subscribe to RSS Feed
- Permalink
- Report Inappropriate Content
That is because you are telling your expression to include all the employees regardless of any selection made on employee list box. Try this:
=If(Metric > 0, Sum({$} TOTAL <Group,Period> Metric)/COUNT({$} TOTAL <Group,Period> Metric))
HTH
Best,
Sunny
- Mark as New
- Bookmark
- Subscribe
- Mute
- Subscribe to RSS Feed
- Permalink
- Report Inappropriate Content
Hi,
I want to include all individuals that belong to a given group. I want the average of all indivuduals who belong to a group, for each period.
That formula returns the following:
| Group | Period | Individual | Metric | Group Average | Group Average v2 |
| 131 | |||||
| b | 0 | n | 68 | 67.5 | 68 |
| b | 1 | n | 63 | 61 | 63 |
Thanks
- Mark as New
- Bookmark
- Subscribe
- Mute
- Subscribe to RSS Feed
- Permalink
- Report Inappropriate Content
Is this the output you are expecting to see? the one you just posted now?
Best,
Sunny
- Mark as New
- Bookmark
- Subscribe
- Mute
- Subscribe to RSS Feed
- Permalink
- Report Inappropriate Content
The output I'm expecting to see is in the Group Average Column. The Group Average v2 returns that individuals performance when selecting only one individual, which is wrong.
The problem is that the table and the graph appear to behave differently.
- Mark as New
- Bookmark
- Subscribe
- Mute
- Subscribe to RSS Feed
- Permalink
- Report Inappropriate Content
A theory I have as to why it isn't working in the graph is that Group isn't appearing on the x-axis. I don't know how to get group to appear.
- Mark as New
- Bookmark
- Subscribe
- Mute
- Subscribe to RSS Feed
- Permalink
- Report Inappropriate Content
It's weird, but seems like it may be a function of your dimensions here. I am unable to figure out why it is happening, but I hope someone else might help.
Best,
Sunny
- Mark as New
- Bookmark
- Subscribe
- Mute
- Subscribe to RSS Feed
- Permalink
- Report Inappropriate Content
You are using a line chart and even if you add more than 1 dimensions to I guess it would calculate your expressions with regard to first dim only.
Try to use a bar chart instead,
Hope it helps.
- Mark as New
- Bookmark
- Subscribe
- Mute
- Subscribe to RSS Feed
- Permalink
- Report Inappropriate Content
if you do not want to use a combo chart you can use the following expression
| sum({<Group = P({<Individual={"$(=(GetFieldSelections(Individual)))"} >}),Individual=,Metric= {">$(=(0))"}>} TOTAL <Group,Period> Metric) | |
| / | |
| COUNT({<Group = P({<Individual={"$(=(GetFieldSelections(Individual)))"} >}),Individual=,Metric= {">$(=(0))"}>} TOTAL <Group,Period> Metric) |
- Mark as New
- Bookmark
- Subscribe
- Mute
- Subscribe to RSS Feed
- Permalink
- Report Inappropriate Content
Thank you!
--Edited after I stared at the formula a bit longer--
So that I can understand better how to use similar capabilities in the future, can confirm for me through how the following section works?
{<Group = P({<Individual={"$(=(GetFieldSelections(Individual)))"} >}),Individual=,Metric= {">$(=(0))"}>}
Between the {} there are 3 different fields that will be filtered:
Group = P({<Individual={"$(=(GetFieldSelections(Individual)))"} >})
means filter for the groups that the individual has resided in at a given point
Individual=
means filter for all individuals regardless of current selection
Metric= {">$(=(0))"}
means filter for Metrics that are greater than 0. This is equivalent to the If statement in my original formula.
Thanks again
- « Previous Replies
-
- 1
- 2
- Next Replies »