Unlock a world of possibilities! Login now and discover the exclusive benefits awaiting you.
- Qlik Community
- :
- All Forums
- :
- QlikView App Dev
- :
- Re: Pivot Chart - Triangle
- Subscribe to RSS Feed
- Mark Topic as New
- Mark Topic as Read
- Float this Topic for Current User
- Bookmark
- Subscribe
- Mute
- Printer Friendly Page
- Mark as New
- Bookmark
- Subscribe
- Mute
- Subscribe to RSS Feed
- Permalink
- Report Inappropriate Content
Pivot Chart - Triangle
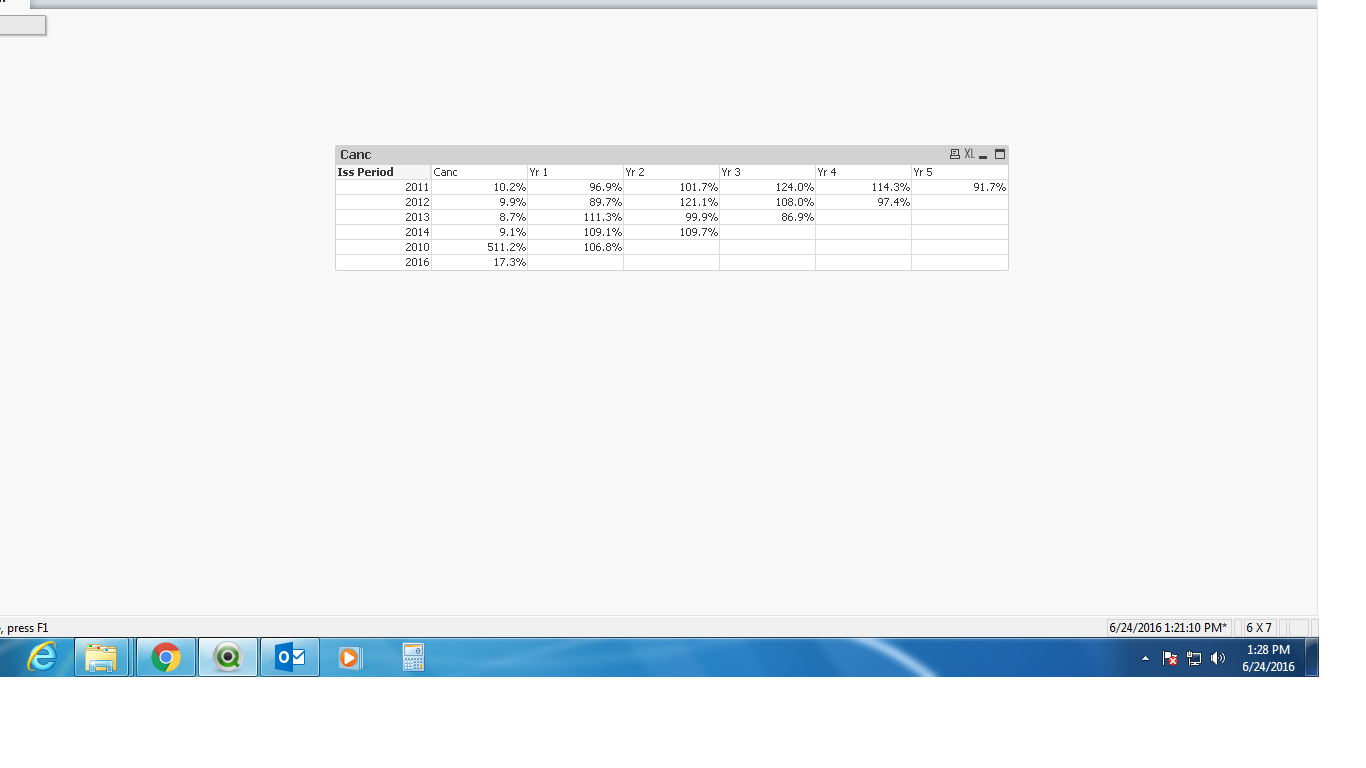
I want to use qlikview to show pivot chart like below to show experience. Basically, for year 2016, the experience of Yr1 is unknown, and I have 0s now in the current display. I want it show as blank, or "-" for the unkown experience. Is there any way I can do it?
| Iss Period | Canc | Yr 1 | Yr 2 | Yr 3 | Yr 4 | Yr 5 |
| 2011 | 10.2% | 96.9% | 101.7% | 124.0% | 114.3% | 91.7% |
| 2012 | 9.9% | 89.7% | 121.1% | 108.0% | 97.4% | |
| 2013 | 8.7% | 111.3% | 99.9% | 86.9% | ||
| 2014 | 9.1% | 109.1% | 109.7% | |||
| 2010 | 511.2% | 106.8% | ||||
| 2016 | 17.3% |
Accepted Solutions
- Mark as New
- Bookmark
- Subscribe
- Mute
- Subscribe to RSS Feed
- Permalink
- Report Inappropriate Content
- Mark as New
- Bookmark
- Subscribe
- Mute
- Subscribe to RSS Feed
- Permalink
- Report Inappropriate Content
May be something like:
if(Field_name=0,' ',Field_name)
- Mark as New
- Bookmark
- Subscribe
- Mute
- Subscribe to RSS Feed
- Permalink
- Report Inappropriate Content
Hi ,
DO you want like this
load * Inline [
Iss Period, Canc, Yr 1, Yr 2, Yr 3, Yr 4, Yr 5
2011, 10.2%, 96.9%, 101.7%, 124.0%, 114.3%, 91.7%
2012, 9.9%, 89.7%, 121.1%, 108.0%, 97.4%, ,
2013, 8.7%, 111.3%, 99.9%, 86.9%, , ,
2014, 9.1%, 109.1%, 109.7%, , ,
2010, 511.2%, 106.8% , , , ,
2016, 17.3%, , , , , ,
];
];
Diemension:-Iss Period
Expression:-
if(Canc=0,' ',Canc)
if(Yr 1=0,' ',Yr 1)
if(Yr 2=0,' ',Yr 2)
if(Yr 3=0,' ',Yr 3)
if(Yr 4=0,' ',Yr 4)
if(Yr 5=0,' ',Yr 5)
Goto Sort Tab check the Expression Write like this
| =Match([Iss Period],2011,2012,2013,2014,2010,2016) |