Unlock a world of possibilities! Login now and discover the exclusive benefits awaiting you.
- Qlik Community
- :
- All Forums
- :
- QlikView App Dev
- :
- Re: Pivot Table Missing Column or Row Labels
- Subscribe to RSS Feed
- Mark Topic as New
- Mark Topic as Read
- Float this Topic for Current User
- Bookmark
- Subscribe
- Mute
- Printer Friendly Page
- Mark as New
- Bookmark
- Subscribe
- Mute
- Subscribe to RSS Feed
- Permalink
- Report Inappropriate Content
Pivot Table Missing Column or Row Labels
Hi all,
I have created a pivot table with two dimensions, Function (Row) and Domain (Column).
When I don't apply filters, all looks fine. When I do, the rows and columns (or headers) are missing. Screenshot below.
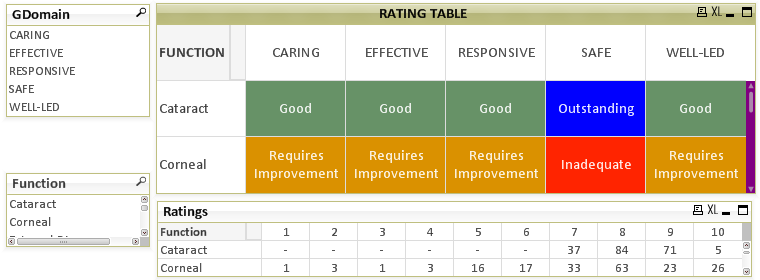
Table 1 without filters applied, all domains are there with all the data (see table below).
Table 2 with filter (Function - Cataract only) applied but it brings up only two domains (Effective and Safe), although the 'Ratings' table has all the data.
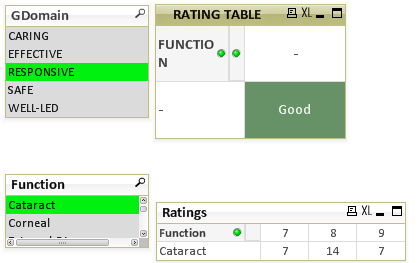
Table 3 with two filters applied (Function - Cataract and Domain - Responsive). Brings up the output and the data but the row and column header are missing. Any advice is appreciated please?
Table 1
Table2

Table 3

- Mark as New
- Bookmark
- Subscribe
- Mute
- Subscribe to RSS Feed
- Permalink
- Report Inappropriate Content
Can attach your qvw with some sample data?
- Mark as New
- Bookmark
- Subscribe
- Mute
- Subscribe to RSS Feed
- Permalink
- Report Inappropriate Content
Hi Karthik,
can you upload an example QVW that illustrates the issue please?
Andy
- Mark as New
- Bookmark
- Subscribe
- Mute
- Subscribe to RSS Feed
- Permalink
- Report Inappropriate Content
- Mark as New
- Bookmark
- Subscribe
- Mute
- Subscribe to RSS Feed
- Permalink
- Report Inappropriate Content
Hi Andrew and Kuszynska,
Sorry, forgot to attach the data. Here it is. The actual qvw file was loaded from a SQL server but this is the excel data output from the SQL server. Hope it helps. If you need anything else, please let me know.
Thanks,
Karthik
- Mark as New
- Bookmark
- Subscribe
- Mute
- Subscribe to RSS Feed
- Permalink
- Report Inappropriate Content
Hi,
check your expression when I Use the aggregation function it's giving Caring, Responsive, well-led becomes null. I think expression you are using are not satisfying the condition for them
I tried this expression
=aggr(if(count({<GRating = {'10'}>} GQuestions)>=3 and count({<GRating = {'<=6'}>}GQuestions)=0, 'Outstanding',
if(count({<GRating = {'<=3'}>}GQuestions)>=3, 'Inadequate',
if(count({<GRating = {'<=6'}>}GQuestions)>=3, 'Requires Improvement',
if(count({<GRating = {'<=3'}>}GQuestions)>=2, 'Requires Improvement', 'Good')))), GFunction, GDomain)
- Mark as New
- Bookmark
- Subscribe
- Mute
- Subscribe to RSS Feed
- Permalink
- Report Inappropriate Content
Hi Kush,
You are spot-on. There was an expression missing for the scores between 7 and 9. I now incorporated it and it works fine. Thank you very much. Much appreciated!
Karthik