Unlock a world of possibilities! Login now and discover the exclusive benefits awaiting you.
- Qlik Community
- :
- All Forums
- :
- QlikView App Dev
- :
- Pivot cell highlight ?
- Subscribe to RSS Feed
- Mark Topic as New
- Mark Topic as Read
- Float this Topic for Current User
- Bookmark
- Subscribe
- Mute
- Printer Friendly Page
- Mark as New
- Bookmark
- Subscribe
- Mute
- Subscribe to RSS Feed
- Permalink
- Report Inappropriate Content
Pivot cell highlight ?
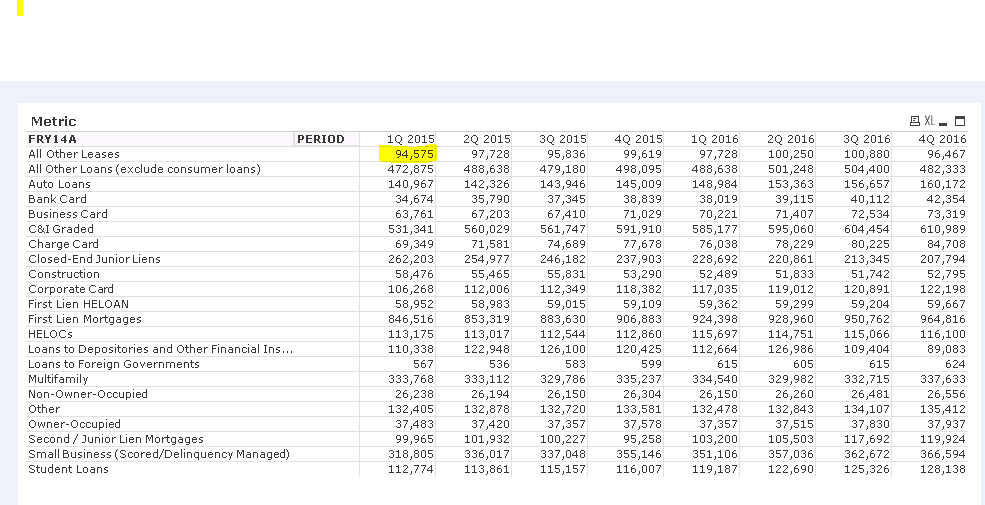
Is there a way to highlight a cell in a pivot chart once you click into that cell ? as indicated below ?

- Tags:
- presentation
- Mark as New
- Bookmark
- Subscribe
- Mute
- Subscribe to RSS Feed
- Permalink
- Report Inappropriate Content
Hi,
Yes possible
Go to Setting --> user preference --> Design Tab --> Select Always show Design menu items.
Then right click on cell you want to highlight and select Custom format cell. --> apply your required formatting here.
Have a look at below post too
Re: custom row colors in pivot table
Regards
ASHFAQ
- Mark as New
- Bookmark
- Subscribe
- Mute
- Subscribe to RSS Feed
- Permalink
- Report Inappropriate Content
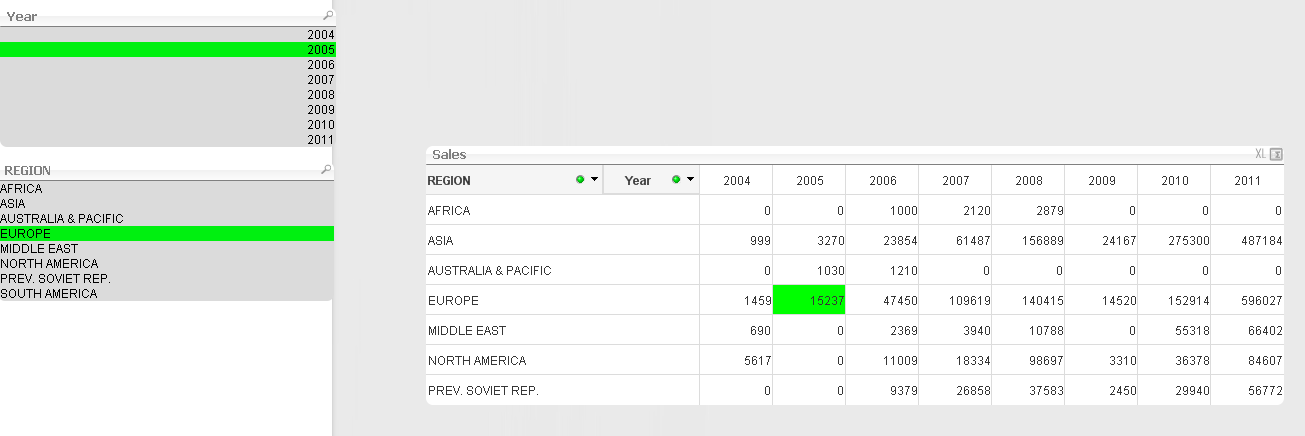
I did get a sample working for this . There are two pieces needed. One expected, one not so much

1. (expected) background color expression on the cell to check if a drill has occurred and which selection was made
if(
(
GetSelectedCount(Year)>0
and
GetSelectedCount(REGION)>0
)
and
(
SubStringCount( Concat(DISTINCT total REGION),REGION)>0
and
SubStringCount( Concat(DISTINCT total Year),Year)>0
)
, LightGreen())
2. ( a little unexpected): I used SET ANALYSIS to ensure that all values still show after the selection, but it causes some inconsistent selection behavior. The solution was to multiply by an aggregation function that does not use SET ANALYIS but also does not change the result:
sum( {<REGION=,Year=>} Sales)
*
(sum( Sales-Sales)+1)
- Mark as New
- Bookmark
- Subscribe
- Mute
- Subscribe to RSS Feed
- Permalink
- Report Inappropriate Content
Jonathan:
a good start Thank You !, But I'm running into issues.
I added the variable as you created, and have my new sheet created.
However when I click on a cell in the pivot, QV seems to be crashing with the image you see.
Gerry