Unlock a world of possibilities! Login now and discover the exclusive benefits awaiting you.
- Qlik Community
- :
- All Forums
- :
- QlikView App Dev
- :
- Re: Pivot cell text color
- Subscribe to RSS Feed
- Mark Topic as New
- Mark Topic as Read
- Float this Topic for Current User
- Bookmark
- Subscribe
- Mute
- Printer Friendly Page
- Mark as New
- Bookmark
- Subscribe
- Mute
- Subscribe to RSS Feed
- Permalink
- Report Inappropriate Content
Pivot cell text color
| Source | Team | BDate | 2017-12-28 | 2018-01-04 | 2018-01-11 | Total | Yearly Target |
| Client1 | Team1 | 510 | 1010 | 1510 | 3030 | 6000 | |
| Client1 | Team2 | 260 | 110 | 160 | 530 | 200 | |
| Client2 | Team1 | 5100 | 10100 | 15100 | 30300 | 40450 | |
| Client2 | Team2 | 600 | 1100 | 1600 | 3300 | 3000 | |
I have the above Pivot data.
Can we have the color textcolor as Red of number of "2017-12-28" if the number is greater than the number of "2018-01-11" else text color should be green.
Also, can we have the textcolor as Yellow of "Total" if the number is greater than "Yearly Target" else text color should be Blue.
- Mark as New
- Bookmark
- Subscribe
- Mute
- Subscribe to RSS Feed
- Permalink
- Report Inappropriate Content
Hi Amar. Yes, you can customize the textcolor (Background Color, Text Format, etc.) of your pivot cells. Open Chart properties -> Expressions or Dimensions
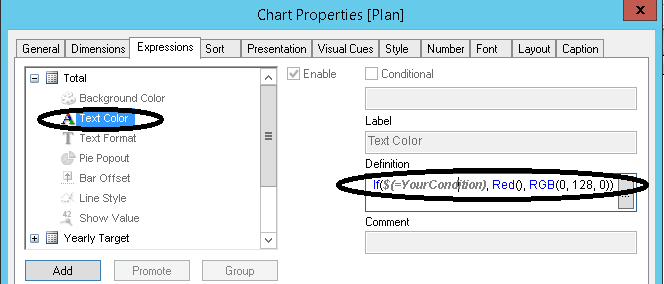
To assign a color use RGB() function or predefined Red(), Blue(), Green() etc. As for "Total" it can be
If([Total] > [Yearly Target], Yellow(), Blue()). In this example [Total] and [Yearly Target] are column names and can be replaced by expressions
If(Sum(Total) > Sum([Yearly Target]), Yellow(), Blue())
- Mark as New
- Bookmark
- Subscribe
- Mute
- Subscribe to RSS Feed
- Permalink
- Report Inappropriate Content
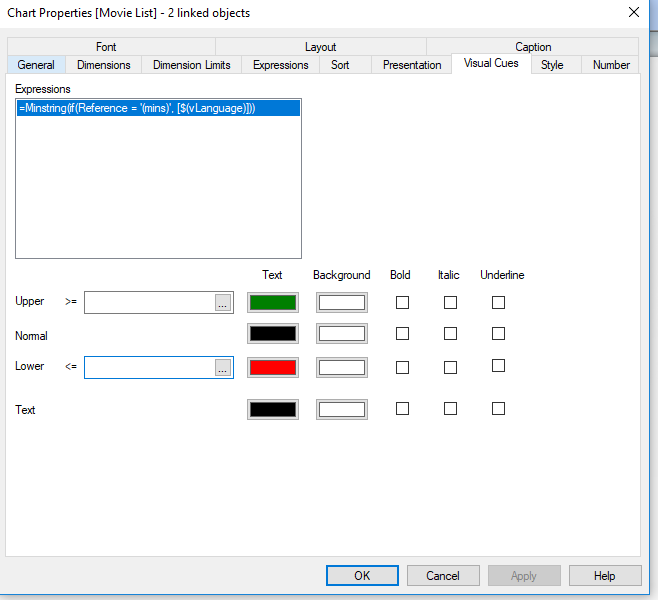
use visual cues in properties. see below
- Mark as New
- Bookmark
- Subscribe
- Mute
- Subscribe to RSS Feed
- Permalink
- Report Inappropriate Content
This can be, will you able to share sample?
- Mark as New
- Bookmark
- Subscribe
- Mute
- Subscribe to RSS Feed
- Permalink
- Report Inappropriate Content
This can be done.
I want to get for the below conditions:
Can we have the color textcolor as Red of number of "2017-12-28" if the number is greater than the number of "2018-01-11" else text color should be green.
Also, can we have the textcolor as Yellow of "Total" if the number is greater than "Yearly Target" else text color should be Blue.
How to get the values of cell "2017-12-28" to be compared with the values of "2018-01-11" ?
- Mark as New
- Bookmark
- Subscribe
- Mute
- Subscribe to RSS Feed
- Permalink
- Report Inappropriate Content
by using visual cues you can change the background color, font, font style just you can write the expression in upper, lower boxes. these will reflect into the data
- Mark as New
- Bookmark
- Subscribe
- Mute
- Subscribe to RSS Feed
- Permalink
- Report Inappropriate Content
Thanks fro your reply.
How to get the values of cell "2017-12-28" to be compared with the values of "2018-01-11" ?