Unlock a world of possibilities! Login now and discover the exclusive benefits awaiting you.
- Qlik Community
- :
- All Forums
- :
- QlikView App Dev
- :
- Re: Pivot table- How do I break the column into 2 ...
- Subscribe to RSS Feed
- Mark Topic as New
- Mark Topic as Read
- Float this Topic for Current User
- Bookmark
- Subscribe
- Mute
- Printer Friendly Page
- Mark as New
- Bookmark
- Subscribe
- Mute
- Subscribe to RSS Feed
- Permalink
- Report Inappropriate Content
Pivot table- How do I break the column into 2 or more sub columns?
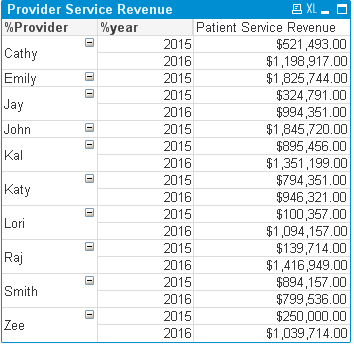
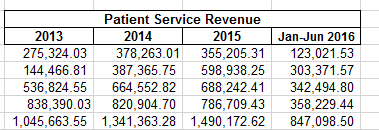
I have a Pivot table with Provider name, their revenue and year. I want revenue to be split into years.
For example My table looks like this:

I want above table (Patient Service Revenue column) look like this:

I have attached example chart also.
- « Previous Replies
-
- 1
- 2
- Next Replies »
Accepted Solutions
- Mark as New
- Bookmark
- Subscribe
- Mute
- Subscribe to RSS Feed
- Permalink
- Report Inappropriate Content
Hi
Check attached.
Create caluculate dim or inline fielsd in backend.drag that to harizental
I hope this may help . 🙂
- Nagarjun
- Mark as New
- Bookmark
- Subscribe
- Mute
- Subscribe to RSS Feed
- Permalink
- Report Inappropriate Content
Something like this?
- Mark as New
- Bookmark
- Subscribe
- Mute
- Subscribe to RSS Feed
- Permalink
- Report Inappropriate Content
I am sure there would be more optimized method to this but here is what I know would work
Create a Inline in your script as 'Dim' with the values as Year & YTD
then
On Dimension tab
1. Provider
2. =Pick(Match(Dim, 'Year', 'YTD'),[YearField],'YTD')
Expression
Pick(Match(Dim,'Year','YTD'),
Your Expression1 for Patient Service Revenue ,
Your Expression2 for YTD Patient Service Revenue
)
Pivot your Table on calculated dimesion.
hope this helps..
- Mark as New
- Bookmark
- Subscribe
- Mute
- Subscribe to RSS Feed
- Permalink
- Report Inappropriate Content
Hi
Check attached.
Create caluculate dim or inline fielsd in backend.drag that to harizental
I hope this may help . 🙂
- Nagarjun
- Mark as New
- Bookmark
- Subscribe
- Mute
- Subscribe to RSS Feed
- Permalink
- Report Inappropriate Content
Yes, Correct. How did you do that? I forgot the settings.
Also, is it possible to make the label "Patient Service revenue" above year? (Just like excel do)
Thanks for your help
Pavithra Shetty
- Mark as New
- Bookmark
- Subscribe
- Mute
- Subscribe to RSS Feed
- Permalink
- Report Inappropriate Content
Look at nagarjuna.kothamandi's sample where he used ValueList. But you can also create a new dimension like this
'Patient Service revenue'
- Mark as New
- Bookmark
- Subscribe
- Mute
- Subscribe to RSS Feed
- Permalink
- Report Inappropriate Content
- Mark as New
- Bookmark
- Subscribe
- Mute
- Subscribe to RSS Feed
- Permalink
- Report Inappropriate Content
Thank you So much. What does "Value List" mean? Just the value that we want to display? or is there any other use of it?
- Mark as New
- Bookmark
- Subscribe
- Mute
- Subscribe to RSS Feed
- Permalink
- Report Inappropriate Content
Thank you very much. I was struggling to drag the column into horizontal. Some how I was not pulling that to all the way to the end. I figured out! ![]()
Thank you for the quick reply. It's a great help to learn the tool.
- Mark as New
- Bookmark
- Subscribe
- Mute
- Subscribe to RSS Feed
- Permalink
- Report Inappropriate Content
ValueList Use:
1. We can create temp dimensions.
2.Without reloading file we can create fileds in front End.
3.Last bur not least , Its like inline load , we can create as much records as we can.
4.Example : ValueList('Ram','Krish','Sri')
-Nagarjun
-
- « Previous Replies
-
- 1
- 2
- Next Replies »