Unlock a world of possibilities! Login now and discover the exclusive benefits awaiting you.
- Qlik Community
- :
- All Forums
- :
- QlikView App Dev
- :
- Pivot table not showing all fields in Dimension
- Subscribe to RSS Feed
- Mark Topic as New
- Mark Topic as Read
- Float this Topic for Current User
- Bookmark
- Subscribe
- Mute
- Printer Friendly Page
- Mark as New
- Bookmark
- Subscribe
- Mute
- Subscribe to RSS Feed
- Permalink
- Report Inappropriate Content
Pivot table not showing all fields in Dimension
Hi all,
Please can you assist, I am trying to replicate a pivot table in QlikView.
This table has 2 age buckets 0-3 days and 4-9 days, however when creating different views of the table, some of the age buckets are not showing, only the ones that has values.
How do I show everything regardless if the expressions are null.
I have tried following solutions posted on other forums, howeber it does not work.
Thank you very much.
Mary
- Tags:
- qlikview dashboard
- « Previous Replies
-
- 1
- 2
- Next Replies »
Accepted Solutions
- Mark as New
- Bookmark
- Subscribe
- Mute
- Subscribe to RSS Feed
- Permalink
- Report Inappropriate Content
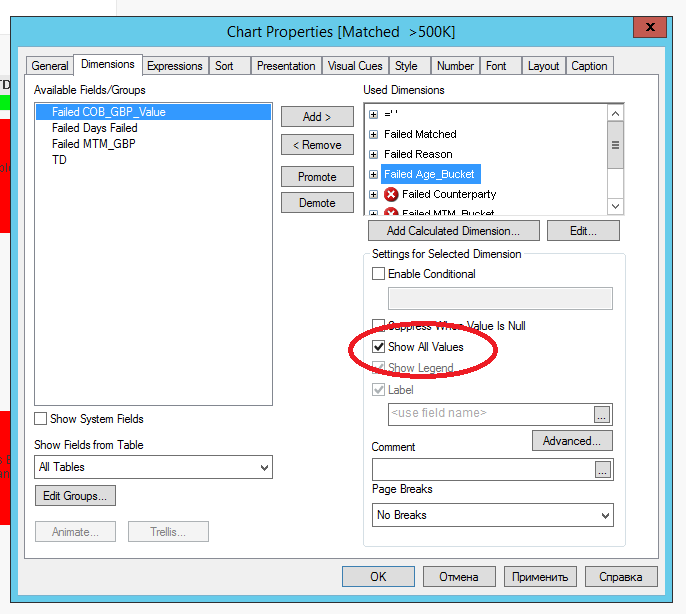
Hi. Dimentions have property "Show all values"

if we check it then we obtain all values of dimension in the chart

- Mark as New
- Bookmark
- Subscribe
- Mute
- Subscribe to RSS Feed
- Permalink
- Report Inappropriate Content
Hi,
Goto Presentation tab and uncheck the Suppress Zero-Values and Suppress Missing check boxes.
- Mark as New
- Bookmark
- Subscribe
- Mute
- Subscribe to RSS Feed
- Permalink
- Report Inappropriate Content
.....and maybe as well tick Show All Values for the relevant dimensions.
- Mark as New
- Bookmark
- Subscribe
- Mute
- Subscribe to RSS Feed
- Permalink
- Report Inappropriate Content
Are you using Class function to create the buckets? Class function won't create a class if there is no data to display within the specific bucket. You might want to consider using if statement or some other approach. In the below link marcowedel used ValueLoop.
- Mark as New
- Bookmark
- Subscribe
- Mute
- Subscribe to RSS Feed
- Permalink
- Report Inappropriate Content
Thank you Krishnapriya, but it doesnt work.
- Mark as New
- Bookmark
- Subscribe
- Mute
- Subscribe to RSS Feed
- Permalink
- Report Inappropriate Content
Thank you Bill, but it doesnt work.
- Mark as New
- Bookmark
- Subscribe
- Mute
- Subscribe to RSS Feed
- Permalink
- Report Inappropriate Content
Thank you Sunny for the reply.
The Age bucket column is currently a column (already defined) in the raw data, based on the Age column.
I have tried the method suggested in the link above and researched Class and Value Loop, however it does not work.
We currently have the following:

Dimensions:
Failed Matched
Failed Reason
Failed Age Bucket
Expression:
No. of items = Count({<[Failed >500_K]={'>500 K'},[Failed Matched]={'Matched'}>}[Failed COB_GBP_Value])
Value (GBP) = Count({<[Failed >500_K]={'>500 K'},[Failed Matched]={'Matched'}>}[Failed COB_GBP_Value])
TM (GBP) = sum({<[Failed >500_K]={'>500 K'},[Failed Matched]={'Matched'}>}[Failed MTM_GBP])
We are missing one bucket ">30".
How would we create an IF statement to show the missing bucket?
Thanks again
- Mark as New
- Bookmark
- Subscribe
- Mute
- Subscribe to RSS Feed
- Permalink
- Report Inappropriate Content
Are you creating Bucket in the script or is it a calculated dimension? Can you share the expression or script used to create bucket?
- Mark as New
- Bookmark
- Subscribe
- Mute
- Subscribe to RSS Feed
- Permalink
- Report Inappropriate Content
No, I am not creating the Bucket in the script and it is not a calculated dimension.
The Age bucket is already calculated in the raw data and we are reading it into QlikView. The Age bucket is based on the Days Failed.
I am using the script below:
[Failed Report]:
LOAD
filename() as [Failed File name],
mid(filename(),26,8) as Name,
mid(filename(),26,2)&'/'&mid(filename(),28,2)&'/'&mid(filename(),30,4) as File_Name_Date,
DATE(Date#(mid(filename(),26,2)&'/'&mid(filename(),28,2)&'/'&mid(filename(),30,4),'DD/MM/YYYY'),'YYYY/MM/DD') as TD,
[Days Failed] as [Failed Days Failed],
[COB GBP Value] as [Failed COB_GBP_Value],
[>100 K] as [Failed >100_K],
[>500 K] as [Failed >500_K],
[Age Bucket] as [Failed Age_Bucket],
[MTM GBP] as [Failed MTM_GBP],
[Matched] as [Failed Matched],
FROM
[..\Fails\*.txt]
(txt, codepage is 1252, embedded labels, delimiter is '\t', msq);
Thanks Sunny
- Mark as New
- Bookmark
- Subscribe
- Mute
- Subscribe to RSS Feed
- Permalink
- Report Inappropriate Content
This is weird, is there a possibility that there is not data available and that is why it isn't getting displayed? Its difficult to say without playing around with the data a little bit. Would you be able to share your application or a sample?
Preparing examples for Upload - Reduction and Data Scrambling
- « Previous Replies
-
- 1
- 2
- Next Replies »