Unlock a world of possibilities! Login now and discover the exclusive benefits awaiting you.
- Qlik Community
- :
- All Forums
- :
- QlikView App Dev
- :
- Plan vs Actual
- Subscribe to RSS Feed
- Mark Topic as New
- Mark Topic as Read
- Float this Topic for Current User
- Bookmark
- Subscribe
- Mute
- Printer Friendly Page
- Mark as New
- Bookmark
- Subscribe
- Mute
- Subscribe to RSS Feed
- Permalink
- Report Inappropriate Content
Plan vs Actual
Good day all,
I need help,
I have a table with plan and actual...
I need to build a chart with the plan represented in a linechart while the actual in a bar chart (in the same plot)
Please find attached file for clarity. Thanks in advance
Regards
- « Previous Replies
-
- 1
- 2
- Next Replies »
- Mark as New
- Bookmark
- Subscribe
- Mute
- Subscribe to RSS Feed
- Permalink
- Report Inappropriate Content
Hi,
may be
Temp:
LOAD SubField(field,'(',1) as field,
If(SubField(field,'(',-1) = 'actual)','A' ,'P') as [A/P],
January,
February
FROM
"https://community.qlik.com/servlet/JiveServlet/download/1135127-248023/test.xlsx"
(ooxml, embedded labels, table is Sheet1);
CrossTable(Month,Value,2)
LOAD field,
[A/P],
January,
February
Resident Temp;
Drop Table Temp;
Regards,
Antonio
- Mark as New
- Bookmark
- Subscribe
- Mute
- Subscribe to RSS Feed
- Permalink
- Report Inappropriate Content
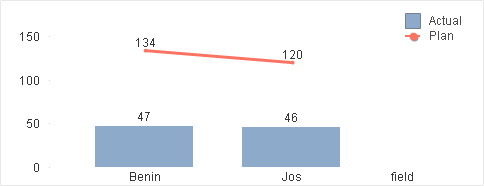
In the attached file, you will see the various location are stack, (their actual are expressed using a bar chart) and their plan as a line chart...
against month of the year.
This is my desired output.
Regards
- Mark as New
- Bookmark
- Subscribe
- Mute
- Subscribe to RSS Feed
- Permalink
- Report Inappropriate Content
Hi
Please find the attached app.
Have displayed Actual as bar and plan as line.
Regards
Harish
- « Previous Replies
-
- 1
- 2
- Next Replies »