Unlock a world of possibilities! Login now and discover the exclusive benefits awaiting you.
Announcements
Introducing Qlik Answers: A plug-and-play, Generative AI powered RAG solution.
READ ALL ABOUT IT!
- Qlik Community
- :
- All Forums
- :
- QlikView App Dev
- :
- Please help on my gauge chart
Options
- Subscribe to RSS Feed
- Mark Topic as New
- Mark Topic as Read
- Float this Topic for Current User
- Bookmark
- Subscribe
- Mute
- Printer Friendly Page
Turn on suggestions
Auto-suggest helps you quickly narrow down your search results by suggesting possible matches as you type.
Showing results for
Creator
2018-10-29
09:48 PM
- Mark as New
- Bookmark
- Subscribe
- Mute
- Subscribe to RSS Feed
- Permalink
- Report Inappropriate Content
Please help on my gauge chart
Hi experts,
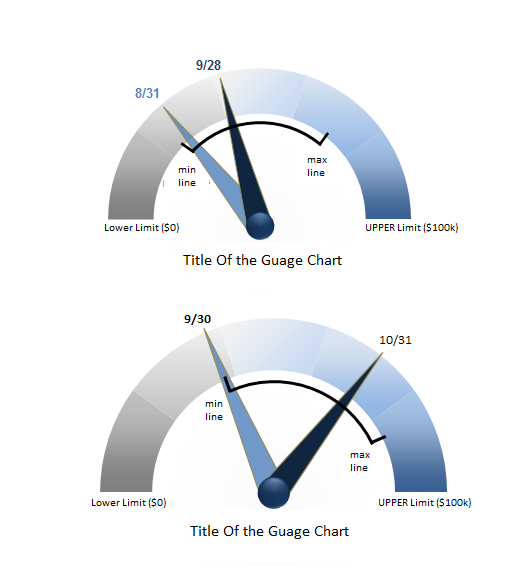
May I know how I can create a gauge chart like below? The two needles indicates the values as of 8/31 and 9/28 separately.
Note that there's a black arc which indicates the max value and min value during this period..
The data looks something like below:
Date, Value
8/31, 26000
9/28, 35000
min line value = 25000
max line value = 65000
The lower chart is for another period, so we can see the black arc changes as the min/max line values change.
I understand that the two needles can be created using two gauge charts one on top of another, but not sure how to create that black arc, could anyone help please?

- Tags:
- gauge chart
328 Views
0 Replies