Unlock a world of possibilities! Login now and discover the exclusive benefits awaiting you.
- Qlik Community
- :
- All Forums
- :
- QlikView App Dev
- :
- Possible to show 2 bars one behind the other in a ...
- Subscribe to RSS Feed
- Mark Topic as New
- Mark Topic as Read
- Float this Topic for Current User
- Bookmark
- Subscribe
- Mute
- Printer Friendly Page
- Mark as New
- Bookmark
- Subscribe
- Mute
- Subscribe to RSS Feed
- Permalink
- Report Inappropriate Content
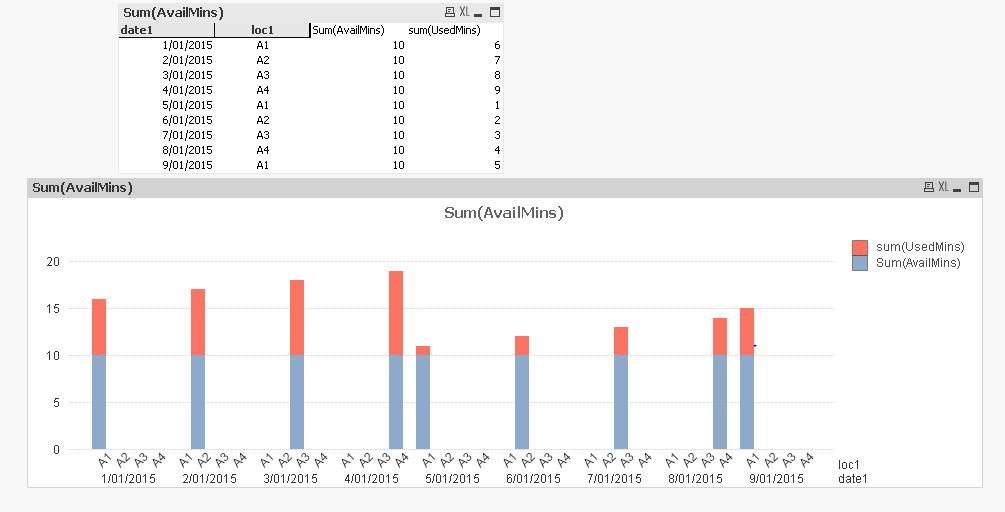
Possible to show 2 bars one behind the other in a chart?
Hi
I have a chart - but I want the UsedMins to be in front of the AvailMins - to show how much of the minutes have been used. Can I force this in QlikView? I have 2 dimensions on the x axis - I could combine them but I would prefer not to.
Thank you for any help you an give.
Jo
- « Previous Replies
-
- 1
- 2
- Next Replies »
- Mark as New
- Bookmark
- Subscribe
- Mute
- Subscribe to RSS Feed
- Permalink
- Report Inappropriate Content
Hi Daniel
the idea is that the Sum(AvailableMinutes) would be one bar (depends on date and machine), the Sum(usedMinutes) would be one bar (depends on date and machine). The visual should show whether there was extra time available or had worked overtime ...
Julian's graph works, but people are grappling with the idea of the labels ...
The idea sort of works with the combined line/bar graph in QlikView. I cannot choose to ungroup??
Jo
- Mark as New
- Bookmark
- Subscribe
- Mute
- Subscribe to RSS Feed
- Permalink
- Report Inappropriate Content
Sorry I dont see a solution at the moment. You might consider another chart type like a line chart
- Mark as New
- Bookmark
- Subscribe
- Mute
- Subscribe to RSS Feed
- Permalink
- Report Inappropriate Content
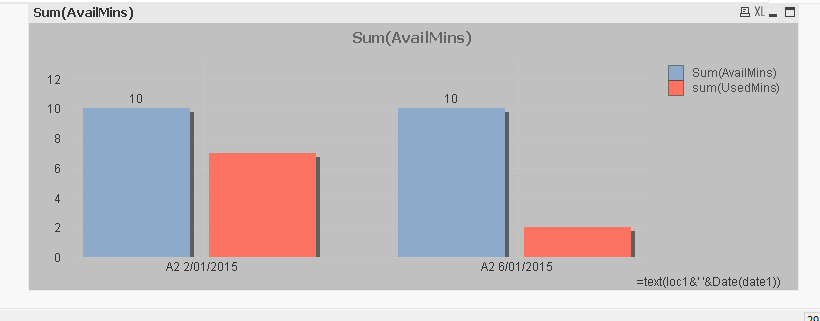
What I had to do was make the x axis a composite ie text(loc1& ' ' &Date(Date1)) - I thinkt his works .
Jo
- « Previous Replies
-
- 1
- 2
- Next Replies »