Unlock a world of possibilities! Login now and discover the exclusive benefits awaiting you.
- Qlik Community
- :
- All Forums
- :
- QlikView App Dev
- :
- Re: Previous year for Pivot Table with Year/Month ...
- Subscribe to RSS Feed
- Mark Topic as New
- Mark Topic as Read
- Float this Topic for Current User
- Bookmark
- Subscribe
- Mute
- Printer Friendly Page
- Mark as New
- Bookmark
- Subscribe
- Mute
- Subscribe to RSS Feed
- Permalink
- Report Inappropriate Content
Previous year for Pivot Table with Year/Month dimension
Hi all.
I am running into an issue where I have a table with a yearmonth dimension (ie, 2014-Nov,2014-Dec etc). I have a column that is simply Sum(Sales) for the month sales. I need a second column showing the sales for the same month of the previous year.
I can't work out how to achieve this. What I want to do is use set analysis to change the YearMonth dimension to be one year previous. Something like: Sum( {$ <YearMonth={'$(=(Left(YearMonth,4)-1)&'-'&Right(YearMonth,3))'} > } Sales)
I know that doesn't work because the dollar sign expansion is done across the whole table, but I can't work out how to achieve the desired result.
It is driving me nuts because it seems straight forward!
- Mark as New
- Bookmark
- Subscribe
- Mute
- Subscribe to RSS Feed
- Permalink
- Report Inappropriate Content
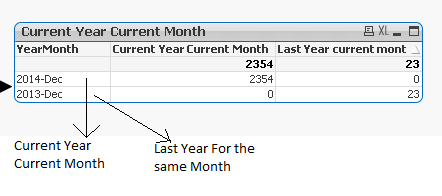
Thanks, but the dimension needs to be YearMonth and when changed to that it no longer works:
I think you have the columns wrong. The first column is for the displayed month (ie 2014-Dec), the second column is for the same month, but the previous year.
- Mark as New
- Bookmark
- Subscribe
- Mute
- Subscribe to RSS Feed
- Permalink
- Report Inappropriate Content
Hi,
If you use YearMonth dimension it is difficult to achieve this, since the dimension values are displayed based on the result of the expression. Since you have to use current and previous year data so, you will get YearMonth values of both the years.
So just display the Month in dimension and create two expressions for current and previous year. For current and previous year give dynamic cacptions as Year like Year(Today()) and Year(Today()) - 1.
Regards,
Jagan.
- Mark as New
- Bookmark
- Subscribe
- Mute
- Subscribe to RSS Feed
- Permalink
- Report Inappropriate Content
try whether you have monthYear as num
by using Num(MonthYear).if it show number then it will work definelty
but if not then try to make it as number and then try formulas
- Mark as New
- Bookmark
- Subscribe
- Mute
- Subscribe to RSS Feed
- Permalink
- Report Inappropriate Content
it works see in the image below

and if you want to show this in better format means you want to remove 0 try the expression in text object and design some UI
- Mark as New
- Bookmark
- Subscribe
- Mute
- Subscribe to RSS Feed
- Permalink
- Report Inappropriate Content
The problem is that the user could select any set of dates, not just the current year. The user could select Jul-Sep 2014, and therefore the LY column would be for Jul, Aug, Sep 2013
- Mark as New
- Bookmark
- Subscribe
- Mute
- Subscribe to RSS Feed
- Permalink
- Report Inappropriate Content
The columns you are using are not what is required. I need column 1 to be for the month shown, and column 2 for the same month of the previous year.
- Mark as New
- Bookmark
- Subscribe
- Mute
- Subscribe to RSS Feed
- Permalink
- Report Inappropriate Content
can you share a snap shot of your requirement,Because I didnt get you, what exactly your requirement,
there are multiple ways to do the thing.
- Mark as New
- Bookmark
- Subscribe
- Mute
- Subscribe to RSS Feed
- Permalink
- Report Inappropriate Content
Thanks for your patience.
Sales for 2014-July would be 150, sales for 2013-July would be 277
Sales for 2014-Aug would be 32, Sales for 2013-Aug would be 353
The user could select anything as the date range. It could be 2011-Sep, 2011-Oct-2011-Nov.
- Mark as New
- Bookmark
- Subscribe
- Mute
- Subscribe to RSS Feed
- Permalink
- Report Inappropriate Content
Create a seperate field for last year data in the script itself. Hope, the blog post: Year Over Comparison would give you an idea.
- Mark as New
- Bookmark
- Subscribe
- Mute
- Subscribe to RSS Feed
- Permalink
- Report Inappropriate Content
I think I have this all sorted out now. The first issue is that Set analysis is done before the table is calculated. That means that effectively the set being used by the column is set in stone when it is calculated. Therefore the row level dimension cannot be considered as part of the set analysis.
In this case, that means that what is happening is that the set analysis was correctly limiting the results to the previous year data. But then the row level dimension further restricted it to the monthyear of the current year. This resulted in the calculation being on an empty set.
The only solution I can think of is to set it up to that the table is restricted to a single year only. Then use months for the dimension. The LY column can then use the set analysis to select only the previous year instead of the current year. The dimension then restricts this only to the month, which is what we want. To make it work correctly add a calculation condition and message to only show the table if there is only a single year selected. Finally, make the label for the dimension be Max(FYear). Now the table shows the year and the rows are the month:

Attached is the completed sample.