Unlock a world of possibilities! Login now and discover the exclusive benefits awaiting you.
- Qlik Community
- :
- All Forums
- :
- QlikView App Dev
- :
- Re: Prob regarding Button
- Subscribe to RSS Feed
- Mark Topic as New
- Mark Topic as Read
- Float this Topic for Current User
- Bookmark
- Subscribe
- Mute
- Printer Friendly Page
- Mark as New
- Bookmark
- Subscribe
- Mute
- Subscribe to RSS Feed
- Permalink
- Report Inappropriate Content
Prob regarding Button
Hey,
I have a chart showing amount of commodities. Now i have created a button named YTD. I want that by clicking on YTD , my chart should show values of all commodities for whole current year. How can i change the values in chart by just clicking on YTD button??
tHanks
- Tags:
- new_to_qlikview
- « Previous Replies
- Next Replies »
Accepted Solutions
- Mark as New
- Bookmark
- Subscribe
- Mute
- Subscribe to RSS Feed
- Permalink
- Report Inappropriate Content
Hi Nikhil,
There are 2 different expressions in this chart. One is to show the default values (i.e MTD in this example) and another on is for YTD. Whenever you click on the button vYTDButton=1 is set and whenever vYTDButton=1, the expression for YTD will be displayed and MTD expression will be hidden. When you click on that button again, vYTDButton will be 0 and MTD expression will be displayed.
The idea is to display/hide the expression in the chart based on the button clicked/not clicked.
Hope you understood. Let me know if you need more information.
Regards,
Laxmi
- Mark as New
- Bookmark
- Subscribe
- Mute
- Subscribe to RSS Feed
- Permalink
- Report Inappropriate Content
Put an action on the button of Type "Select in Field"
- Mark as New
- Bookmark
- Subscribe
- Mute
- Subscribe to RSS Feed
- Permalink
- Report Inappropriate Content
Ohk but does by inserting select in field option changes the values in
chart when i click the button? Do i need to set variable also?
- Mark as New
- Bookmark
- Subscribe
- Mute
- Subscribe to RSS Feed
- Permalink
- Report Inappropriate Content
Hi Nikhil
Check this Dynamically Selecting Timeframes
- Mark as New
- Bookmark
- Subscribe
- Mute
- Subscribe to RSS Feed
- Permalink
- Report Inappropriate Content
Hi,
Create your button and add an action 'Select in the field'.
Select your date field
And add the action
= '>=' & YearStart(today())
- Mark as New
- Bookmark
- Subscribe
- Mute
- Subscribe to RSS Feed
- Permalink
- Report Inappropriate Content
Hi Nikhil,
You can create two different expression in your chart and enable/disable these expression based on the button value(0 or 1)
I have attached a sample application.
Hope this helps.
- Mark as New
- Bookmark
- Subscribe
- Mute
- Subscribe to RSS Feed
- Permalink
- Report Inappropriate Content
Hey Laxmi,
I am using personal edition so can you plz tell me the script you have written.
thanx
- Mark as New
- Bookmark
- Subscribe
- Mute
- Subscribe to RSS Feed
- Permalink
- Report Inappropriate Content
Hi Nikhil,
This is the sample table I have created in my application..
LOAD * INLINE [
COMMODITY, MTD, YTD
A ,100, 5
B, 200, 14
C, 160, 32
];
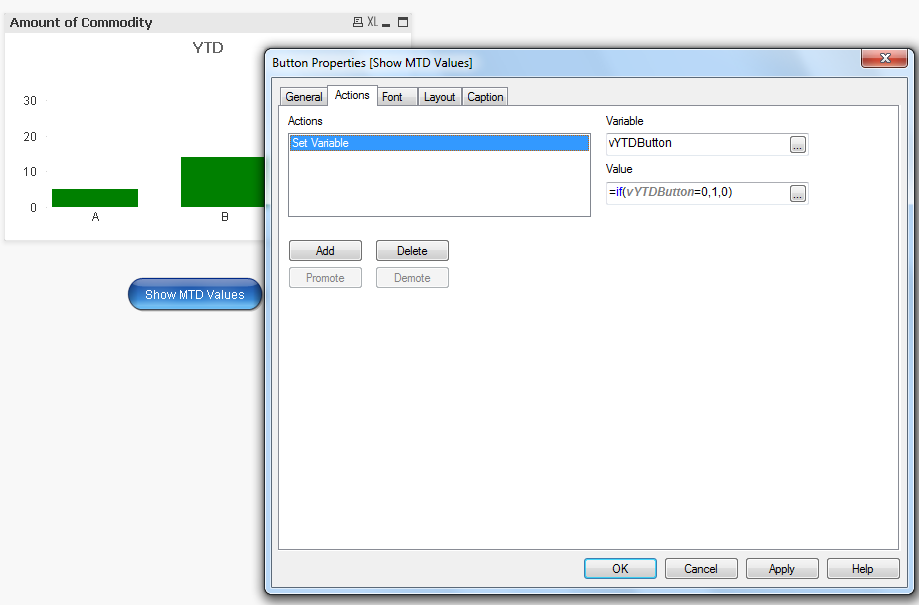
The chart is showing 2 different values, MTD and YTD. By default it will be MTS and when the user clicks on a button shown in the screenshot below 'YTD values' will be displayed. You can find the enable/disable conditions for both expressions in the screenshots. vYTDButton is the variable created to toggle between MTD and YTD values.
MTD Expression:
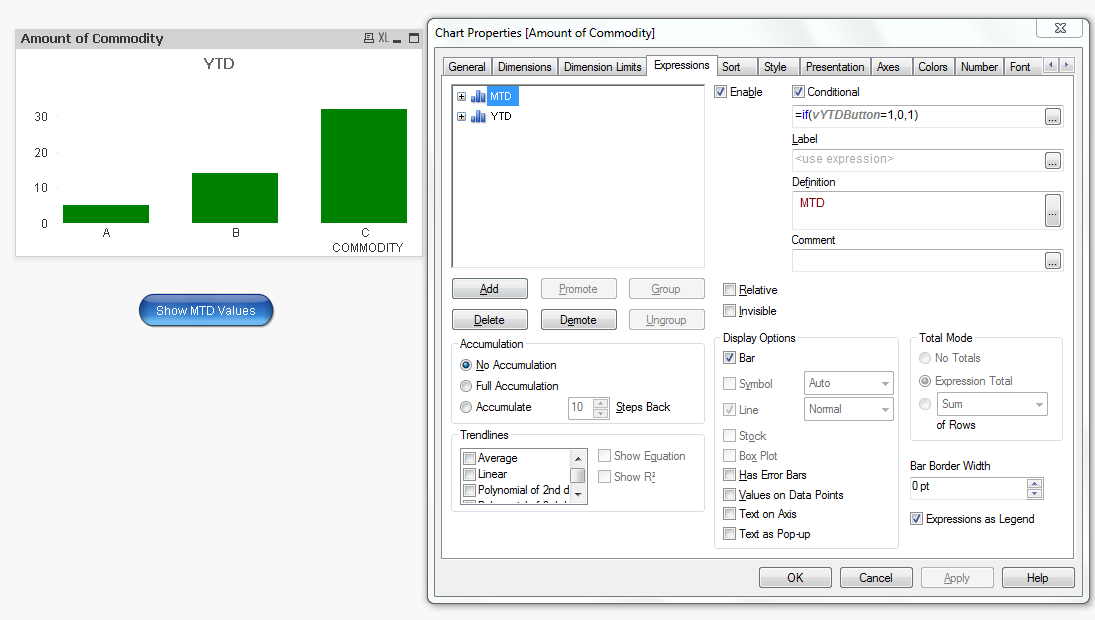
YTD Expression:

Button Action:
Regards,
Laxmi
- Mark as New
- Bookmark
- Subscribe
- Mute
- Subscribe to RSS Feed
- Permalink
- Report Inappropriate Content
Hey,
thanks but i didn't get it.
You ahve created only one button(Show MTD). On that button properties , you have set values:
if(vYTDButton = 0,1,0). : What does this 0,1,0 indicates??
In expression you have written 2 expressions :
For MTD , you have written ; if(vYTD = 1,0,1) , i didn't get this what does it means? and similarly for YTD expression.
Can you plz explain.
THnaks
- Mark as New
- Bookmark
- Subscribe
- Mute
- Subscribe to RSS Feed
- Permalink
- Report Inappropriate Content
Hi Nikhil,
There are 2 different expressions in this chart. One is to show the default values (i.e MTD in this example) and another on is for YTD. Whenever you click on the button vYTDButton=1 is set and whenever vYTDButton=1, the expression for YTD will be displayed and MTD expression will be hidden. When you click on that button again, vYTDButton will be 0 and MTD expression will be displayed.
The idea is to display/hide the expression in the chart based on the button clicked/not clicked.
Hope you understood. Let me know if you need more information.
Regards,
Laxmi
- « Previous Replies
- Next Replies »