Unlock a world of possibilities! Login now and discover the exclusive benefits awaiting you.
- Qlik Community
- :
- All Forums
- :
- QlikView App Dev
- :
- Re: Problem sorting chart with conditional express...
- Subscribe to RSS Feed
- Mark Topic as New
- Mark Topic as Read
- Float this Topic for Current User
- Bookmark
- Subscribe
- Mute
- Printer Friendly Page
- Mark as New
- Bookmark
- Subscribe
- Mute
- Subscribe to RSS Feed
- Permalink
- Report Inappropriate Content
Problem sorting chart with conditional expressions
Hi there,
I've an issue sorting my chart.
The use case is, that I have a chart calculating values for the last 12/24 rolling months or 4/8 rolling quarters. Therefore my chart shows wheter 4, 8, 12 or 24 columns, depending on the selection of type (quarterly/monthly) and duration (12/24 months).
To sum those values up I've got one more expression calculating the total of the last 12/24 rolling months or 4/8 rolling quarters.
I'd like to always sort my chart by this total column, but as soon as I change one of the options type or duration the chart loses the sort setting of sorting by this Total column descending.
Attached you can find a sample application with the same problem.
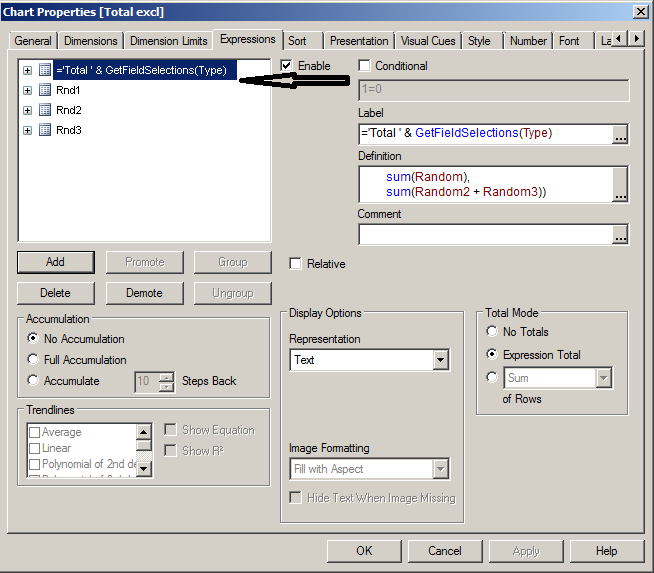
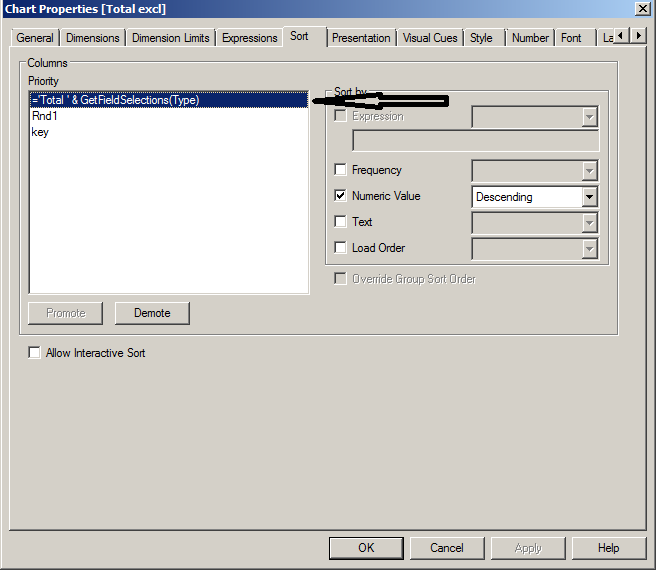
I'd like to sort by the total column, therefore I change the priority of the total column in the chart to the top and select sort by numeric value descending.
As soon as i switch the type, the sort order is set to default again.
Any suggestions how I could avoid this problem?
I don't want to change the straight table to a pivot chart.
Thanks in advance
Patrick
- « Previous Replies
-
- 1
- 2
- Next Replies »
Accepted Solutions
- Mark as New
- Bookmark
- Subscribe
- Mute
- Subscribe to RSS Feed
- Permalink
- Report Inappropriate Content
Hi
Since you are conditionally manipulating the number of columns that are displayed in the table, the sort order is getting changed ..
I think one way to get your sorting priority constant, You need to promote your total to the top of the list in the expressions tab and set the sorting priority. This should work if you do not have a problem in displaying the total column first in the grid


- Mark as New
- Bookmark
- Subscribe
- Mute
- Subscribe to RSS Feed
- Permalink
- Report Inappropriate Content
Try this:
Best,
Sunny
- Mark as New
- Bookmark
- Subscribe
- Mute
- Subscribe to RSS Feed
- Permalink
- Report Inappropriate Content
I already took this Option into account.
Unfortunately this brings up another problem. I've got more than just one dimension.
Sorting dim1 by expression leads to the total column not being sorted completely descending. I'm writing from my smart phone, I hope I can explain the example properly:
| Dimension1 | Dimension2 | Total |
|---|---|---|
| Customer 5 | variant 02 | 534 |
| Customer 5 | variant 01 | 236 |
| Customer 23 | variant 02 | 610 |
| Customer 23 | variant 01 | 34 |
| Customer 23 | variant 03 | 27 |
| Customer 13 | variant 03 | 465 |
| Customer 13 | variant 01 | 68 |
But the sort order I would like to have is:
610
534
465
236
68
34
27
Thanks
Patrick
- Mark as New
- Bookmark
- Subscribe
- Mute
- Subscribe to RSS Feed
- Permalink
- Report Inappropriate Content
I see what you are saying now. While looking for a permanent solution still, I can suggest a work around of placing two charts on top of each other and conditionally hide and show them based on your GetCurrentField() selection.
- Mark as New
- Bookmark
- Subscribe
- Mute
- Subscribe to RSS Feed
- Permalink
- Report Inappropriate Content
Although still a work around, but its better than having two charts. Using the following script I created a new field with a combination of Dimension1&Dimension2 and called it sort
Table:
LOAD Dimension1,
Dimension2,
Total as Value,
Dimension1&Dimension2 as Sort
FROM
[https://community.qlik.com/thread/169261]
(html, codepage is 1252, embedded labels, table is @1);
Added Sort as a dimension for you chart and hide it and use a expression sort on this new field.
Seems to work, see if this is helpful.
Best,
Sunny
- Mark as New
- Bookmark
- Subscribe
- Mute
- Subscribe to RSS Feed
- Permalink
- Report Inappropriate Content
Thanks for your help, I think I'm going to discuss this topic with my client again.
Could be the sort by expression is still enough for him.
If it's not enough I'll need to calculate everything in the script.
Thanks!
Patrick
- Mark as New
- Bookmark
- Subscribe
- Mute
- Subscribe to RSS Feed
- Permalink
- Report Inappropriate Content
But still I'd like to know if this behaviour is as expected or not.
- Mark as New
- Bookmark
- Subscribe
- Mute
- Subscribe to RSS Feed
- Permalink
- Report Inappropriate Content
I am not sure if this is the intended behavior, but I have seen that this is what I have seen for some of the other charts I have made within the applications I have worked on. But since there was never an importance on getting the sorting right, I never worked on getting it right for more than 5-10 mins and moved on with what I got.
- Mark as New
- Bookmark
- Subscribe
- Mute
- Subscribe to RSS Feed
- Permalink
- Report Inappropriate Content
Hi
Since you are conditionally manipulating the number of columns that are displayed in the table, the sort order is getting changed ..
I think one way to get your sorting priority constant, You need to promote your total to the top of the list in the expressions tab and set the sorting priority. This should work if you do not have a problem in displaying the total column first in the grid


- Mark as New
- Bookmark
- Subscribe
- Mute
- Subscribe to RSS Feed
- Permalink
- Report Inappropriate Content
Hi,
Can you try the below attachment.
- « Previous Replies
-
- 1
- 2
- Next Replies »