Unlock a world of possibilities! Login now and discover the exclusive benefits awaiting you.
- Qlik Community
- :
- All Forums
- :
- QlikView App Dev
- :
- Re: Qlikview charts
- Subscribe to RSS Feed
- Mark Topic as New
- Mark Topic as Read
- Float this Topic for Current User
- Bookmark
- Subscribe
- Mute
- Printer Friendly Page
- Mark as New
- Bookmark
- Subscribe
- Mute
- Subscribe to RSS Feed
- Permalink
- Report Inappropriate Content
Qlikview charts
hi,
I have a scenerio where I have a loading month which contains values of a particular good for 12 months i.e Jan-Dec in a bar chart.Now I want that when I select loading month Jun,I should be able to see Month from Jan to jun in green colour and rest months in red colour, again If I select loading month Mar, I should be able to see in bar chart month jan to mar in green colour and rest months in red colour..
How can I do this in front end
Thanks in anticipation
- Mark as New
- Bookmark
- Subscribe
- Mute
- Subscribe to RSS Feed
- Permalink
- Report Inappropriate Content
look at this
- Mark as New
- Bookmark
- Subscribe
- Mute
- Subscribe to RSS Feed
- Permalink
- Report Inappropriate Content
I didnt find any attachment.pls reply soon..
Thanks
- Mark as New
- Bookmark
- Subscribe
- Mute
- Subscribe to RSS Feed
- Permalink
- Report Inappropriate Content
should be attached, please check
- Mark as New
- Bookmark
- Subscribe
- Mute
- Subscribe to RSS Feed
- Permalink
- Report Inappropriate Content
Hi Neha,
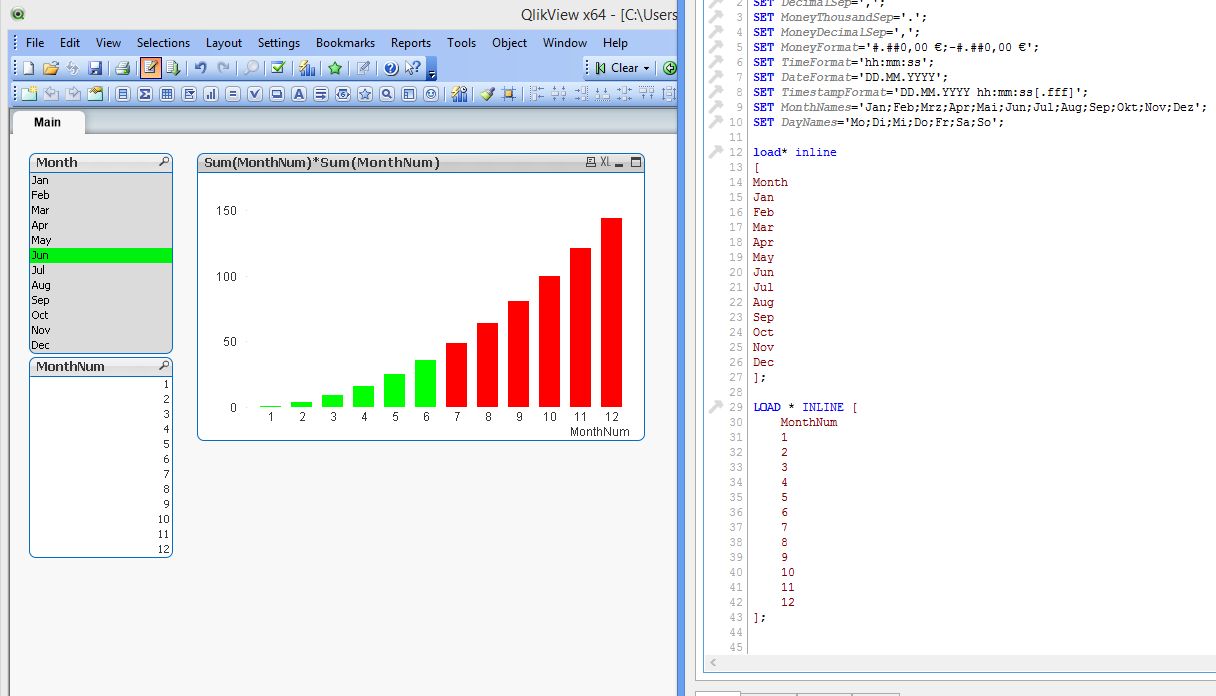
this is a solution without makro. Please see the picture:
The expression for the color of the bars is:
If(MonthNum <= Match(Month, 'Jan', 'Feb', 'Mar', 'Apr', 'May', 'Jun', 'Jul', 'Aug', 'Sep', 'Oct', 'Nov', 'Dec'), RGB(0, 255,0), RGB(255, 0, 0))
Hope this helps
Burkhard
- Mark as New
- Bookmark
- Subscribe
- Mute
- Subscribe to RSS Feed
- Permalink
- Report Inappropriate Content
Hi Neha,
last night I had the idea of a much more elegant solution to your problem.
Please, follow these 3 steps:
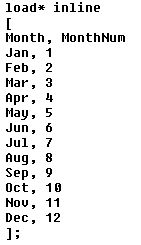
i) this is your script to use

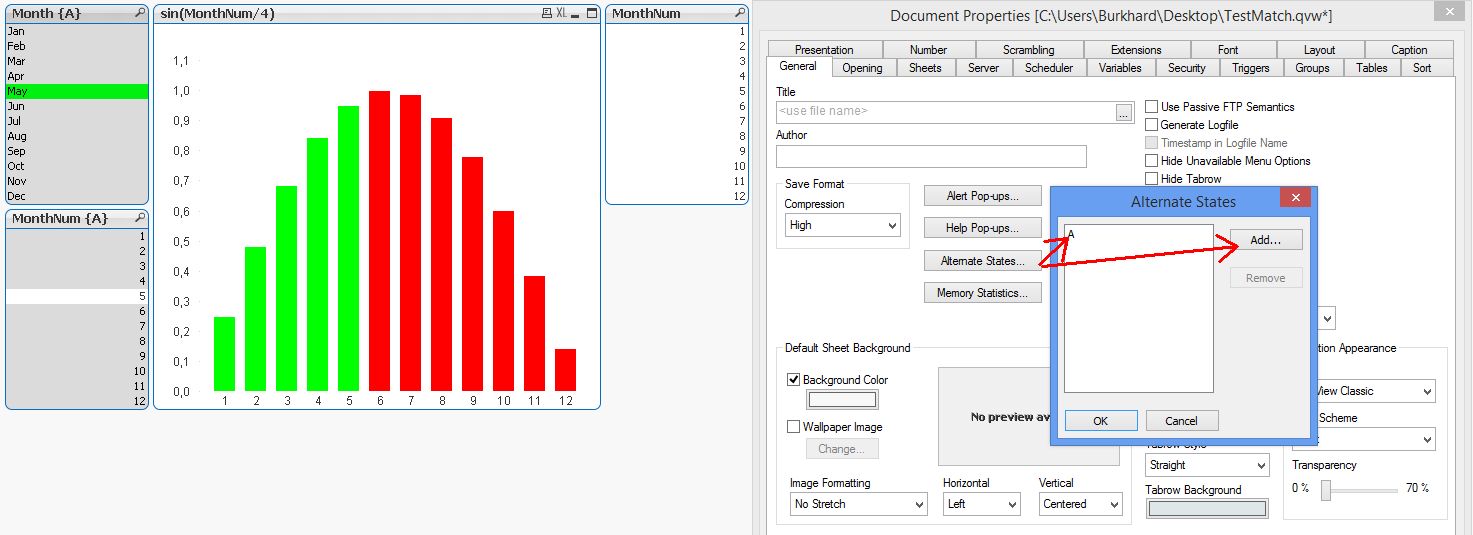
ii) Add an alternate state to your app, e. g. 'A' and chose this state for the month listbox where your user will do the selections on the month

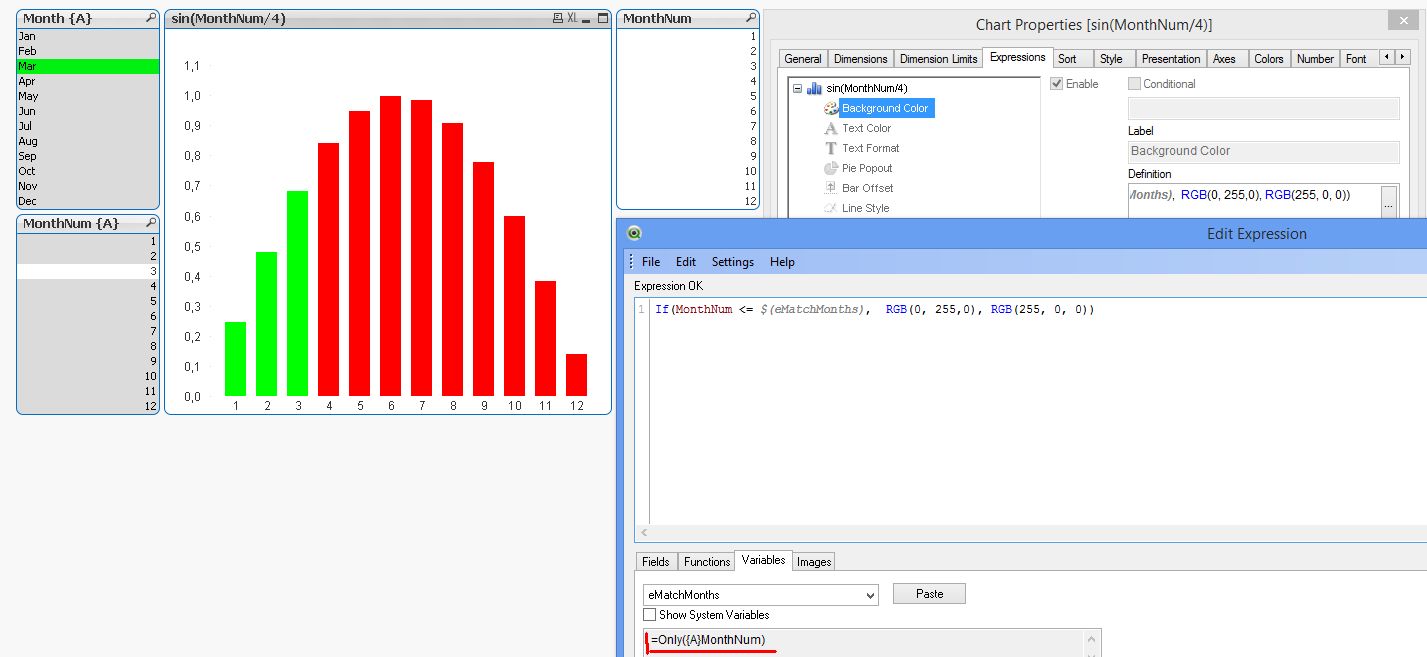
iii) Create a variable and assign this value to it: =Only({A}MonthNum), don't forget the equal sign.
Use this variable in the expression for the color of the bars in your chart.

That's it.
Happy qliking
Burkhard