Unlock a world of possibilities! Login now and discover the exclusive benefits awaiting you.
- Qlik Community
- :
- All Forums
- :
- QlikView App Dev
- :
- Re: Quadrants in Scatter Plot (QlikView)
- Subscribe to RSS Feed
- Mark Topic as New
- Mark Topic as Read
- Float this Topic for Current User
- Bookmark
- Subscribe
- Mute
- Printer Friendly Page
- Mark as New
- Bookmark
- Subscribe
- Mute
- Subscribe to RSS Feed
- Permalink
- Report Inappropriate Content
Quadrants in Scatter Plot (QlikView)
Hi
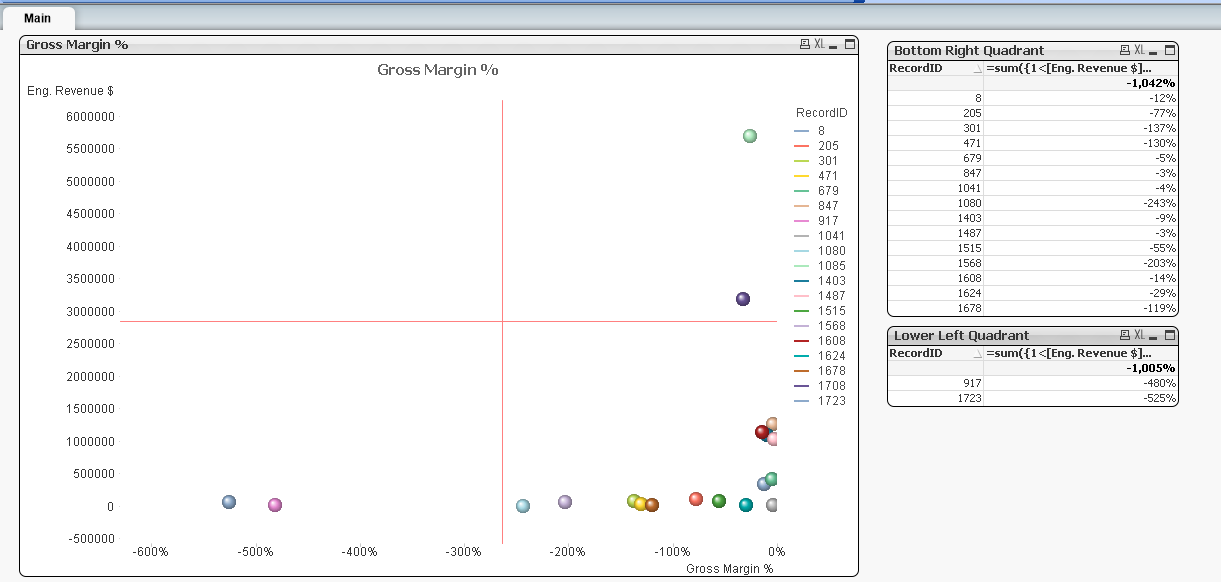
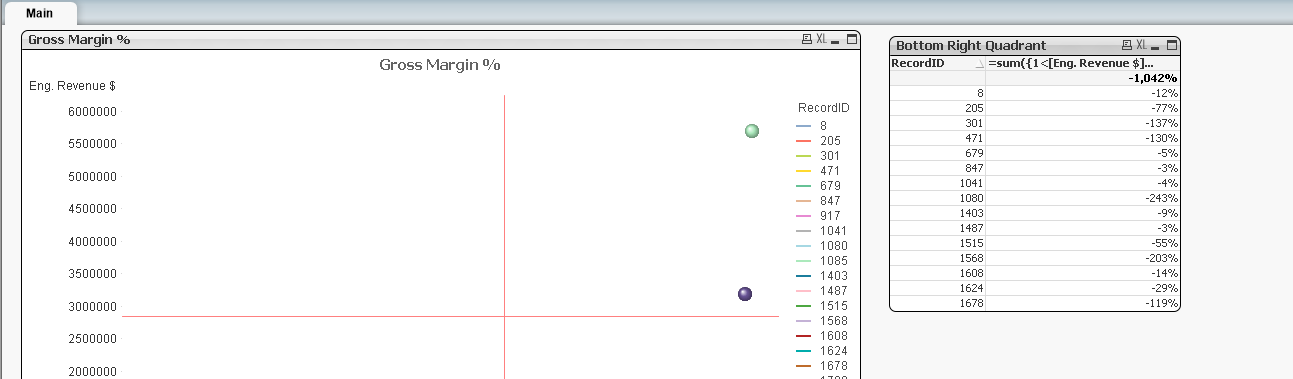
I attached the sample scatter plot which compares Revenue vs GM %.
I also added quadrants.
Is there a way to get the list of bubbles from lower left quadrant into a table?
I added fast change option to straight table and asked the user to click and open the details. But no luck
Please help
- « Previous Replies
-
- 1
- 2
- Next Replies »
Accepted Solutions
- Mark as New
- Bookmark
- Subscribe
- Mute
- Subscribe to RSS Feed
- Permalink
- Report Inappropriate Content
It is basically the same thing. I think you would want calculations (tables or set analysis) to represent each quadrant. The bottom left quadrant would be less than the x-axis and less than the y-axis
=sum({1<[Eng. Revenue $]={"<$(=(Max(Aggr(Sum([Eng. Revenue $]),RecordID))+Min(Aggr(Sum([Eng. Revenue $]),RecordID)))/2)"},
[Gross Margin %]={"<=$(=(Max(Aggr(Sum([Gross Margin %]),RecordID))+Min(Aggr(Sum([Gross Margin %]),RecordID)))/2)"}>}[Gross Margin %])
- Mark as New
- Bookmark
- Subscribe
- Mute
- Subscribe to RSS Feed
- Permalink
- Report Inappropriate Content
Some one. Please help...
- Mark as New
- Bookmark
- Subscribe
- Mute
- Subscribe to RSS Feed
- Permalink
- Report Inappropriate Content
The manual way would just ask the user to select the bubbles in the quadrant and then the straight table should have the correct data.
Can you use the same formula that defines the quadrants in a set analysis expression. Create 4 buttons, each representing a quadrant. Each button has an action that assigns the formula to a variable. If the variable is empty, it does not affect the content of the scatter chart.
Sum({$<$(vQuadrant)>} Amt)
- Mark as New
- Bookmark
- Subscribe
- Mute
- Subscribe to RSS Feed
- Permalink
- Report Inappropriate Content
I mentioned the manual way to user. It did not help.
They need to see the list of bottom left quadrant as Low performers in a table.
Not sure on what basis we need to capture the lower quadrant people
- Mark as New
- Bookmark
- Subscribe
- Mute
- Subscribe to RSS Feed
- Permalink
- Report Inappropriate Content
Any one?
Please help
- Mark as New
- Bookmark
- Subscribe
- Mute
- Subscribe to RSS Feed
- Permalink
- Report Inappropriate Content
Can you share some sample data and your expected output? Would be easy if you share a qvw file if possible?
- Mark as New
- Bookmark
- Subscribe
- Mute
- Subscribe to RSS Feed
- Permalink
- Report Inappropriate Content
Attached is the sample APP.
I need the list of Record ID's in this scatter plot falling under lower quadrant. !
- Mark as New
- Bookmark
- Subscribe
- Mute
- Subscribe to RSS Feed
- Permalink
- Report Inappropriate Content
Can you do something like below. I created a straight table and set the expression to be greater than the x-axis formula and less than the y-axis formula of the scatter plot reference lines.
=sum({1<[Eng. Revenue $]={"<$(=(Max(Aggr(Sum([Eng. Revenue $]),RecordID))+Min(Aggr(Sum([Eng. Revenue $]),RecordID)))/2)"},
[Gross Margin %]={">=$(=(Max(Aggr(Sum([Gross Margin %]),RecordID))+Min(Aggr(Sum([Gross Margin %]),RecordID)))/2)"}>}[Gross Margin %])
You could use a button to hide/show the straight table.
- Mark as New
- Bookmark
- Subscribe
- Mute
- Subscribe to RSS Feed
- Permalink
- Report Inappropriate Content
This is fine. But we need the list of only record id's falling in lower left quadrant.
In this example, it is Record ID's 917 and 1723
- Mark as New
- Bookmark
- Subscribe
- Mute
- Subscribe to RSS Feed
- Permalink
- Report Inappropriate Content
I just modified your expression as below and it worked.
Please let me know if this is fine?
=sum({1<[Eng. Revenue $]={"<$(=(Max(Aggr(Sum([Eng. Revenue $]),RecordID))+Min(Aggr(Sum([Eng. Revenue $]),RecordID)))/2)"},
[Gross Margin %]={"<=$(=(Max(Aggr(Sum([Gross Margin %]),RecordID))+Min(Aggr(Sum([Gross Margin %]),RecordID)))/2)"}>}[Gross Margin %])
- « Previous Replies
-
- 1
- 2
- Next Replies »