- Mark as New
- Bookmark
- Subscribe
- Mute
- Subscribe to RSS Feed
- Permalink
- Report Inappropriate Content
Quarter End Value
Hi All,
I have 2 years of data with the expression as sum(Amt1) + sum(Amt2). In a chart i just want to display quarter end and the quarter end values. For eg:- Jan-2014 values are 100+200 , Feb-2014 values are 200+300, March values are 400+500, So in a chart i just need to display March-2014 and value as 900(400+500). Hope my explanation is clear, let me know if not.
Thanks & Regards,
Ankit Modi
- Tags:
- new_to_qlikview
Accepted Solutions
- Mark as New
- Bookmark
- Subscribe
- Mute
- Subscribe to RSS Feed
- Permalink
- Report Inappropriate Content
- Mark as New
- Bookmark
- Subscribe
- Mute
- Subscribe to RSS Feed
- Permalink
- Report Inappropriate Content
NOT CLEAR...!
- Mark as New
- Bookmark
- Subscribe
- Mute
- Subscribe to RSS Feed
- Permalink
- Report Inappropriate Content
Hi Manish,
I have the below data:
| YRMON | Amount1 | Amount2 |
| 201301 | 100 | |
| 201302 | 200 | 700 |
| 201303 | 300 | 800 |
| 201304 | 400 | |
| 201305 | 500 | 1000 |
| 201306 | 600 | 1100 |
| 201307 | 700 | 1200 |
| 201308 | 800 | |
| 201309 | 900 | 1300 |
| 201310 | 1000 | 1500 |
| 201311 | 1100 | 1600 |
| 201312 | 1200 | 1700 |
| 201401 | 1300 | 1800 |
| 201402 | 1400 | |
| 201403 | 1500 | 2000 |
| 201404 | 1600 | |
| 201405 | 1700 | 2200 |
| 201406 | 1800 | 2300 |
| 201407 | 1900 | |
| 201408 | 2000 | 2500 |
| 201409 | 2100 | 2600 |
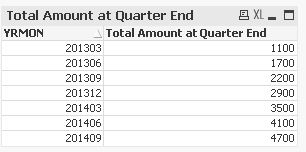
OUTPUT:
| 201303 | 1100 |
| 201306 | 1700 |
| 201309 | 2200 |
| 201312 | 2900 |
| 201403 | 3100 |
| 201406 | 4100 |
| 201409 | 4700 |
I want to display in a chart only the Quarter End Year-Mon(Dimension) and the values of the Quarter end as shown above not the sum of the Quarters. I hope i made this bit clear now..
- Mark as New
- Bookmark
- Subscribe
- Mute
- Subscribe to RSS Feed
- Permalink
- Report Inappropriate Content
Create a field "Quarter" in your calendar and just associate it to your months correctly. For example, a quarter value of 201306 would be associated to month 201304, 201305, and 201306. Then just use that new field as your chart dimension.
Regards,
Vlad
- Mark as New
- Bookmark
- Subscribe
- Mute
- Subscribe to RSS Feed
- Permalink
- Report Inappropriate Content

