Unlock a world of possibilities! Login now and discover the exclusive benefits awaiting you.
- Qlik Community
- :
- All Forums
- :
- QlikView App Dev
- :
- Re: Question
- Subscribe to RSS Feed
- Mark Topic as New
- Mark Topic as Read
- Float this Topic for Current User
- Bookmark
- Subscribe
- Mute
- Printer Friendly Page
- Mark as New
- Bookmark
- Subscribe
- Mute
- Subscribe to RSS Feed
- Permalink
- Report Inappropriate Content
Question
Is there a way I can show the top 5 claims and the top 5 incomes for each month in each year and the amount of those claims and income for my data set.
- Tags:
- new_to_qlikview
- « Previous Replies
- Next Replies »
Accepted Solutions
- Mark as New
- Bookmark
- Subscribe
- Mute
- Subscribe to RSS Feed
- Permalink
- Report Inappropriate Content
from dimensionlimits tab,
1. click on ur dimension from life side (Limits)
2.Options box uncheck Show others!,on same tab.
- Mark as New
- Bookmark
- Subscribe
- Mute
- Subscribe to RSS Feed
- Permalink
- Report Inappropriate Content
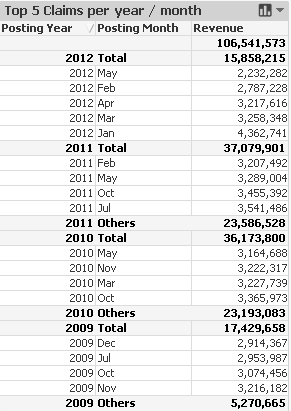
Create a Pivot Table
Dimensions
Posting Year
Posting Month
%PolicyID
Expression
SUM({<Type = {'Claims'}, %PolicyID = {"=Rank(SUM({<Type = {'Claims'}>}Amount),4)<=5"}>}Amount)
- Mark as New
- Bookmark
- Subscribe
- Mute
- Subscribe to RSS Feed
- Permalink
- Report Inappropriate Content
something like that?
- Mark as New
- Bookmark
- Subscribe
- Mute
- Subscribe to RSS Feed
- Permalink
- Report Inappropriate Content
Looks like my above solution would not work..
Here is the new one..
Create a Pivot Table
Dimensions
Posting Year
Posting Month
Type
=IF(Aggr(Rank(SUM(Amount),4),[Posting Month],Type,[Posting Year],%PolicyID)<=5,%PolicyID)
The last one is Calculated Dimension
Expression
SUM({<Type = {'Claims'}>}Amount)
Same way you can find the Income also..
Hope this will help !
Dont forget to select SHow Partial Sum From Presentation Tab...
- Mark as New
- Bookmark
- Subscribe
- Mute
- Subscribe to RSS Feed
- Permalink
- Report Inappropriate Content
Hi Stephen
Can you not try work it out yourself?
- Mark as New
- Bookmark
- Subscribe
- Mute
- Subscribe to RSS Feed
- Permalink
- Report Inappropriate Content
Hi Manish,
I don't understand what you mean by calculated dimension.
Regards,
Stephen.
- Mark as New
- Bookmark
- Subscribe
- Mute
- Subscribe to RSS Feed
- Permalink
- Report Inappropriate Content
Hi Ioannis,
Yes, like above but i do not know how to write the code so the top 5 is in a bar chart
- Mark as New
- Bookmark
- Subscribe
- Mute
- Subscribe to RSS Feed
- Permalink
- Report Inappropriate Content
I reduced the data to 2011 2012 to make the file smaller
- Mark as New
- Bookmark
- Subscribe
- Mute
- Subscribe to RSS Feed
- Permalink
- Report Inappropriate Content
Hi Manish,
Thanks for your help, this is amazing but far too detailed for what I am looking for. I am trying to show the top 5 claims in each year and represent it in a bar chart, I now don't think I need it per month. I also would like to show the lowest 5 claims in each year
Regards,
Stephen
- Mark as New
- Bookmark
- Subscribe
- Mute
- Subscribe to RSS Feed
- Permalink
- Report Inappropriate Content
You mentioned in your question,,, each month and each year !!!!
Ok..so
Create a Bar Chart
Dimension
Posting Year
Type
=IF(Aggr(Rank(SUM(Amount),4),Type,[Posting Year],%PolicyID)<=5,%PolicyID)
Expression
SUM({<Type = {'Claims'}>}Amount)
- « Previous Replies
- Next Replies »