Unlock a world of possibilities! Login now and discover the exclusive benefits awaiting you.
- Qlik Community
- :
- All Forums
- :
- QlikView App Dev
- :
- Re: Rank/ Aggr for Pivot table to get top 5
- Subscribe to RSS Feed
- Mark Topic as New
- Mark Topic as Read
- Float this Topic for Current User
- Bookmark
- Subscribe
- Mute
- Printer Friendly Page
- Mark as New
- Bookmark
- Subscribe
- Mute
- Subscribe to RSS Feed
- Permalink
- Report Inappropriate Content
Rank/ Aggr for Pivot table to get top 5
I want Top 5 fruits for 2016 and 2017 to be listed in the uploaded qvw. If Top 5 of both year is not possible then I want top 5 fruits by 2017
I tried using dimensions limit by making it straight table. But then when i try to move the Fiscal year to the top column by moving blue arrow I cant. So I used pivot table, but in pivot table the dimension limits go away.
I think I need to use aggr function with rank function, but not sure how.
Can someone help me here?
Thanks once again
- Tags:
- rank and aggr
- « Previous Replies
-
- 1
- 2
- Next Replies »
Accepted Solutions
- Mark as New
- Bookmark
- Subscribe
- Mute
- Subscribe to RSS Feed
- Permalink
- Report Inappropriate Content
Use expression:
=If(Rank(Count({<FY = {2016,2017}>} [Customer ID]), 1, 1) < 5, Count({<FY = {2016,2017}>} [Customer ID]))
Dimensions:
Fruits (vertical)
FY (horizontal)
You get more than 5 values because of the ties - for example the 3 instances of value 2 in 2016 are all Rank 4.
PS - I replaced the calculated dimension with the field FY and used the set expression to filter the years,
- Mark as New
- Bookmark
- Subscribe
- Mute
- Subscribe to RSS Feed
- Permalink
- Report Inappropriate Content
TRY
=if(aggr(rank(Count(Fruits),1,1),Fruits)<=5,Fruits)
If a post helps to resolve your issue, please accept it as a Solution.
- Mark as New
- Bookmark
- Subscribe
- Mute
- Subscribe to RSS Feed
- Permalink
- Report Inappropriate Content
Use expression:
=If(Rank(Count({<FY = {2016,2017}>} [Customer ID]), 1, 1) < 5, Count({<FY = {2016,2017}>} [Customer ID]))
Dimensions:
Fruits (vertical)
FY (horizontal)
You get more than 5 values because of the ties - for example the 3 instances of value 2 in 2016 are all Rank 4.
PS - I replaced the calculated dimension with the field FY and used the set expression to filter the years,
- Mark as New
- Bookmark
- Subscribe
- Mute
- Subscribe to RSS Feed
- Permalink
- Report Inappropriate Content
if(num(aggr(Rank(Count({<FY={'2017'}>}[Customer ID])),Fruits)<=5),Count({<FY={'2017'}>}[Customer ID]))
if(num(aggr(Rank(Count({<FY={'2016'}>}[Customer ID])),Fruits)<=5),Count({<FY={'2016'}>}[Customer ID]))
Hi, try above, Remove FY from Dimensions, add 2 expressions, one for each year 2016 and 2017.
This is very much hardcoded, but you can change the year against variables instead.
- Mark as New
- Bookmark
- Subscribe
- Mute
- Subscribe to RSS Feed
- Permalink
- Report Inappropriate Content
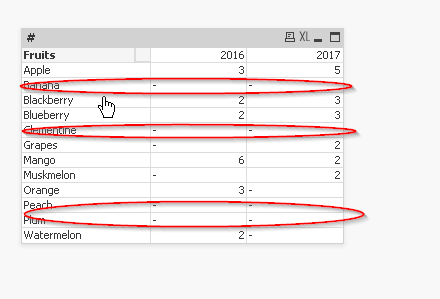
this looks good but how do I use suppress nulls. I clicked on suppress null checkbox but still see this

- Mark as New
- Bookmark
- Subscribe
- Mute
- Subscribe to RSS Feed
- Permalink
- Report Inappropriate Content
Check 'Suppress Zero Values' on dimensions tab
- Mark as New
- Bookmark
- Subscribe
- Mute
- Subscribe to RSS Feed
- Permalink
- Report Inappropriate Content
already tried that..doesnt work
- Mark as New
- Bookmark
- Subscribe
- Mute
- Subscribe to RSS Feed
- Permalink
- Report Inappropriate Content
Do you have more than one expression? I don't see why it should not suppress those if you have Suppress Zero Values on presentation tab checked if you only have one expression?
- Mark as New
- Bookmark
- Subscribe
- Mute
- Subscribe to RSS Feed
- Permalink
- Report Inappropriate Content
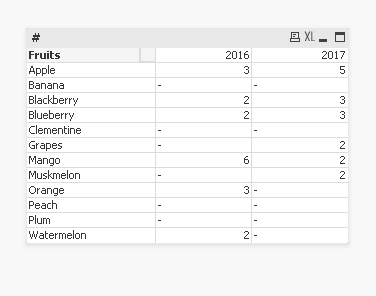
Do you see this when you open the attached file?
Update: Used Jonathan's expression
- Mark as New
- Bookmark
- Subscribe
- Mute
- Subscribe to RSS Feed
- Permalink
- Report Inappropriate Content

I see as above ![]() why?
why?
I opened the qvw that u had attcahed in your reply
- « Previous Replies
-
- 1
- 2
- Next Replies »