Unlock a world of possibilities! Login now and discover the exclusive benefits awaiting you.
- Qlik Community
- :
- All Forums
- :
- QlikView App Dev
- :
- Rank Function
- Subscribe to RSS Feed
- Mark Topic as New
- Mark Topic as Read
- Float this Topic for Current User
- Bookmark
- Subscribe
- Mute
- Printer Friendly Page
- Mark as New
- Bookmark
- Subscribe
- Mute
- Subscribe to RSS Feed
- Permalink
- Report Inappropriate Content
Rank Function
Hi everyone,
Can anyone explain rank function with an example?
Many thanks,
Murali
- Mark as New
- Bookmark
- Subscribe
- Mute
- Subscribe to RSS Feed
- Permalink
- Report Inappropriate Content
Hi murali,
Brief explaination of rank function:
Create a calculated dimension to display top N values
Make sure that you check “Suppress when value is NULL” for the calculated dimension.
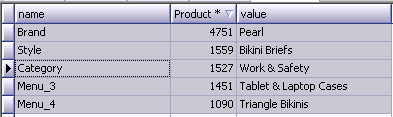
= aggr(if(Rank(sum(product))<= 5 ,name),name)
Above expression creates below list of 5 products
Thanks praneetha
- Mark as New
- Bookmark
- Subscribe
- Mute
- Subscribe to RSS Feed
- Permalink
- Report Inappropriate Content

anant
- Mark as New
- Bookmark
- Subscribe
- Mute
- Subscribe to RSS Feed
- Permalink
- Report Inappropriate Content
hi
see attachment
- Mark as New
- Bookmark
- Subscribe
- Mute
- Subscribe to RSS Feed
- Permalink
- Report Inappropriate Content
Pls check enclosed file...
- Mark as New
- Bookmark
- Subscribe
- Mute
- Subscribe to RSS Feed
- Permalink
- Report Inappropriate Content
Rank function:
It is just like giving Serial number to our record set based by some field.
Suppose if we have as below:
Product , Quantity
Shoes, 10
Shoes,20,
Shirt,1
Shirt, 13
Shirt, 14
Pant,12
Then Rank(Product) will give us row number based on different product values
Product , Quantity, rank(Product)
Shoes, 10,1
Shoes,20,,2
Shirt,1,3
Shirt, 13,1
Shirt, 14,2
Pant,12,1
Thanks,
Angad
- Mark as New
- Bookmark
- Subscribe
- Mute
- Subscribe to RSS Feed
- Permalink
- Report Inappropriate Content
This was a very helpful discussion! Wondering how to apply the Rank function based on a certain dimension.
I'm displaying this in a trellis chart by Industry, showing the month over month % change over time. But, I'd like to:
1. Rank Industries based on their % change MOM from the prior month to current. In other words, highest % change for Mar.
2. Display only the top x number of Industries based on this ranking.
I've figured out how to Rank(pct_chg_MOM) to rank these by industry, and also how to Rank(total pct_chg_MOM) to get overall ranks, but am not clear how to accomplish the above.
One option I thought of is to use rank(total pct_chg_MOM) but then look only at Mar. But again, stuck on how to look only at Mar.
My data looks like this:
| Industry | Month | pct_chg_MOM | Rank |
|---|---|---|---|
| ABC | Jan | -.08 | |
| ABC | Feb | -.03 | |
| ABC | Mar | 1.0 | |
| DEF | Jan | 0.9 | |
| DEF | Feb | 1.1 | |
| DEF | Mar | 0.4 |
- Mark as New
- Bookmark
- Subscribe
- Mute
- Subscribe to RSS Feed
- Permalink
- Report Inappropriate Content
Hello Tina,
Is it possible for you to share a sample app for this with expected results? I believe in expression "pct_chg_MOM" you are using set analysis.
I did the similar thing, by using set analysis, and taking max month number from selection and then comparing it with previous month.
You must have a unique number, to identify which month is going.
For this we use MonthSeq calculated in script while creating master calendar.
Num(Month(TempDate)) + (YearStd-1)*12 AS MonthSeq
Hope this was helpful.
Thanks,
Angad