Unlock a world of possibilities! Login now and discover the exclusive benefits awaiting you.
- Qlik Community
- :
- All Forums
- :
- QlikView App Dev
- :
- Rank Help
- Subscribe to RSS Feed
- Mark Topic as New
- Mark Topic as Read
- Float this Topic for Current User
- Bookmark
- Subscribe
- Mute
- Printer Friendly Page
- Mark as New
- Bookmark
- Subscribe
- Mute
- Subscribe to RSS Feed
- Permalink
- Report Inappropriate Content
Rank Help
Afternoon folks,
I have the below table in my Qlikview app, and I am trying to add a Rank Column to the far left of it. How do I write a rank expression for this table that ranks the data by the success % (high to low), then by # of docs (again high to low) and then by Site Code (A-Z) so that I achieve the visible ranking in the ranking column below:
| Rank | Site Code | Site Name | # of Docs | Failure | Success | Other | Total | Success % |
|---|---|---|---|---|---|---|---|---|
| 1 | B | B | 1058 | 0 | 1057 | 1 | 1058 | 100.00% |
| 2 | J | J | 136 | 0 | 4 | 0 | 4 | 100.00% |
| 3 | C | C | 940 | 26 | 883 | 3 | 912 | 97.14% |
| 4 | A | A | 7097 | 326 | 5962 | 25 | 6313 | 94.82% |
| 5 | G | G | 371 | 26 | 142 | 3 | 171 | 84.52% |
| 6 | F | F | 381 | 37 | 201 | 8 | 246 | 84.45% |
| 7 | E | E | 578 | 50 | 188 | 0 | 238 | 78.99% |
| 8 | D | D | 743 | 51 | 189 | 3 | 243 | 78.75% |
| 9 | H | H | 179 | 0 | 0 | 0 | 0 | - |
| 10 | I | I | 172 | 00 | 0 | 0 | 0 | - |
I have googled how to do this but can't actually find the method I'm looking for.
Thanks,
Gareth
- « Previous Replies
-
- 1
- 2
- Next Replies »
Accepted Solutions
- Mark as New
- Bookmark
- Subscribe
- Mute
- Subscribe to RSS Feed
- Permalink
- Report Inappropriate Content
Not sure Gareth.... very difficult to say without having a look my friend
You can check the expression we are ranking and try to adjust the weights
RangeSum(
([Success]
/
([Success] + [Failure]))*100000,
Total/1E5,
-Rank(TOTAL [Site Code]/1E10))
Make sure you see this with a lot of 0s after decimal point. Something like this
- Mark as New
- Bookmark
- Subscribe
- Mute
- Subscribe to RSS Feed
- Permalink
- Report Inappropriate Content
Wich expression is "Success %" ?
- Mark as New
- Bookmark
- Subscribe
- Mute
- Subscribe to RSS Feed
- Permalink
- Report Inappropriate Content
Success % is "Success / (Success + Failure)"
Thanks
- Mark as New
- Bookmark
- Subscribe
- Mute
- Subscribe to RSS Feed
- Permalink
- Report Inappropriate Content
Would you be able to share a qvw sample to look at this?
- Mark as New
- Bookmark
- Subscribe
- Mute
- Subscribe to RSS Feed
- Permalink
- Report Inappropriate Content
and "Success" and "Failure"?
- Mark as New
- Bookmark
- Subscribe
- Mute
- Subscribe to RSS Feed
- Permalink
- Report Inappropriate Content
Hi,
QVW Sample attached.
Thanks,
Gareth
- Mark as New
- Bookmark
- Subscribe
- Mute
- Subscribe to RSS Feed
- Permalink
- Report Inappropriate Content
May be this
Rank(TOTAL
RangeSum(
[Success]
/
([Success] + [Failure]),
[# of Docs]/1E5))
- Mark as New
- Bookmark
- Subscribe
- Mute
- Subscribe to RSS Feed
- Permalink
- Report Inappropriate Content
Thanks Sunny,
Almost there with!
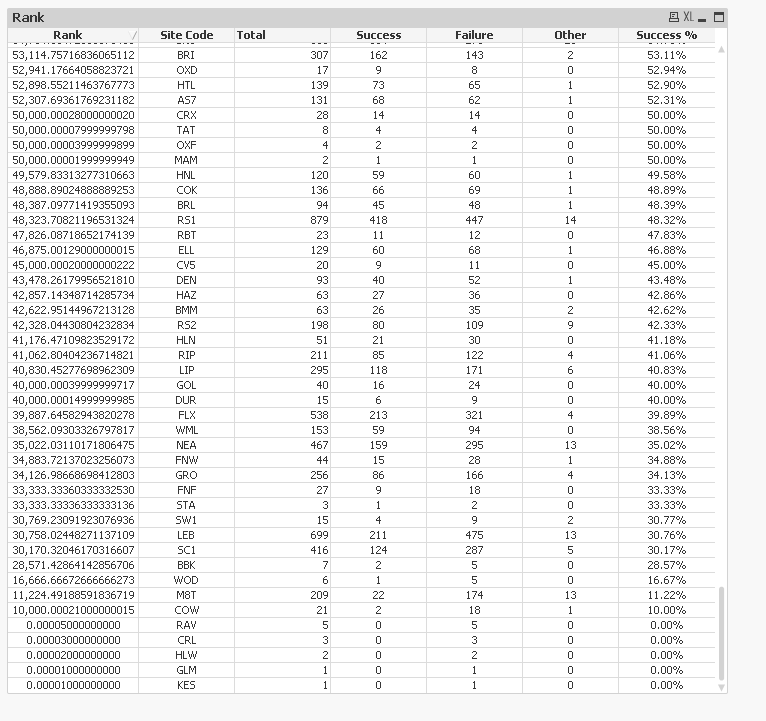
When I amend the expression to suit my business' real life app, I'm getting a few anomalies as you will see from the attached Excel file.
Firstly, Rank 1 shouldn't be NMO, but ESX.
Also, where there are sites with the same score and number of docs, they aren't being given an individual ranking (which is what I was trying to get using the sort by name as the third sort criteria).
The expression I'm using is
Rank(TOTAL
RangeSum(
Count({<[FTMR_P2P_KPI]={"Success"},[Purchase Order Document Type - Code]-={''} >} Distinct [Invoice Number])
/
(Count({<[FTMR_P2P_KPI]={"Success"},[Purchase Order Document Type - Code]-={''} >} Distinct [Invoice Number]) + Count({<[FTMR_P2P_KPI]={"Failure"},[Purchase Order Document Type - Code]-={''} >} Distinct [Invoice Number])),
Count({<[FTMR_P2P_KPI]={"Failure","Success"},[Purchase Order Document Type - Code]-={''} >} Distinct [Invoice Number])/1E5))
Any ideas?
Many thanks again.
Gareth
- Mark as New
- Bookmark
- Subscribe
- Mute
- Subscribe to RSS Feed
- Permalink
- Report Inappropriate Content
Try this
Rank(TOTAL
RangeSum(
Count({<[FTMR_P2P_KPI]={"Success"},[Purchase Order Document Type - Code]-={''} >} Distinct [Invoice Number])
/
(Count({<[FTMR_P2P_KPI]={"Success"},[Purchase Order Document Type - Code]-={''} >} Distinct [Invoice Number]) + Count({<[FTMR_P2P_KPI]={"Failure"},[Purchase Order Document Type - Code]-={''} >} Distinct [Invoice Number])),
Count({<[FTMR_P2P_KPI]={"Failure","Success"},[Purchase Order Document Type - Code]-={''} >} Distinct [Invoice Number])/1E8,
-Rank(TOTAL [Site Code])/1E10))
- Mark as New
- Bookmark
- Subscribe
- Mute
- Subscribe to RSS Feed
- Permalink
- Report Inappropriate Content
So close.
The sorting on the score is correct now, it's just some of the ranking is showing as a 7-11 where the scores are the same. Is there anyway of splitting this down to 7, 8, 9, 10, 11?
Thanks,
Gareth
- « Previous Replies
-
- 1
- 2
- Next Replies »