Unlock a world of possibilities! Login now and discover the exclusive benefits awaiting you.
- Qlik Community
- :
- All Forums
- :
- QlikView App Dev
- :
- Re: Rank () is not working as expected.
- Subscribe to RSS Feed
- Mark Topic as New
- Mark Topic as Read
- Float this Topic for Current User
- Bookmark
- Subscribe
- Mute
- Printer Friendly Page
- Mark as New
- Bookmark
- Subscribe
- Mute
- Subscribe to RSS Feed
- Permalink
- Report Inappropriate Content
Rank () is not working as expected.
Hello all,
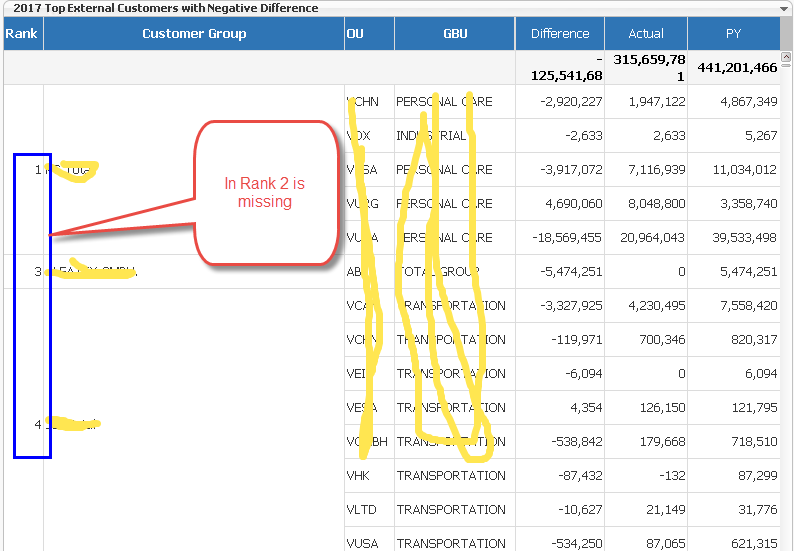
i have one pivot table chart in which i am showing data based on TOP 20 Negetive Difference.
now table now showing 2nd rank, it is showing 1,3,4,5,6,7 and so on.....

Can any one suggest?
Thanks in advance.
- « Previous Replies
-
- 1
- 2
- Next Replies »
- Mark as New
- Bookmark
- Subscribe
- Mute
- Subscribe to RSS Feed
- Permalink
- Report Inappropriate Content
What is the calculated dimension used to calculate Rank?
- Mark as New
- Bookmark
- Subscribe
- Mute
- Subscribe to RSS Feed
- Permalink
- Report Inappropriate Content
thanks for reply...
we have to rank our customer_group based on "Difference" column (third from the right in screenshot), so we are using same expression which we are using in "Difference" column and we are just aggr() it by "Customer Group" dimension.
- Mark as New
- Bookmark
- Subscribe
- Mute
- Subscribe to RSS Feed
- Permalink
- Report Inappropriate Content
=aggr(rank(
CurrentYear_Invoice
-
PY_Invoice
))
*-1),Customer_Group)
- Mark as New
- Bookmark
- Subscribe
- Mute
- Subscribe to RSS Feed
- Permalink
- Report Inappropriate Content
great, but what is the expression ![]()
- Mark as New
- Bookmark
- Subscribe
- Mute
- Subscribe to RSS Feed
- Permalink
- Report Inappropriate Content
Did you try creating a new chart with
Dimension
Customer_Group
Expression
Rank(CurrentYear_Invoice - PY_Invoice))*-1)
and then see that are you getting RANK 2 for any Customer_Group or not?
- Mark as New
- Bookmark
- Subscribe
- Mute
- Subscribe to RSS Feed
- Permalink
- Report Inappropriate Content
=aggr(rank (only{1}(CurrentYear_Invoice-PY_Invoice))*-1) ),Customer_Group)
- Mark as New
- Bookmark
- Subscribe
- Mute
- Subscribe to RSS Feed
- Permalink
- Report Inappropriate Content
Hey did you use more dimensions on this chart where you calculate rank.
- Mark as New
- Bookmark
- Subscribe
- Mute
- Subscribe to RSS Feed
- Permalink
- Report Inappropriate Content
Rank() is tricky...
It can skip number "2" if there is more than one that ranks highest.
Further, you seem to have multiple dimensions. Then you need to be on top of whether the Rank() refers to the last dimension only or whether it is for the total. See picture below.
HIC

- Mark as New
- Bookmark
- Subscribe
- Mute
- Subscribe to RSS Feed
- Permalink
- Report Inappropriate Content
Depending on the parameters of the Rank expression, it looks like you have a tie for first place or for second place. The optional 3rd parametert determines how ties are handled (rank up or down).
- « Previous Replies
-
- 1
- 2
- Next Replies »