Unlock a world of possibilities! Login now and discover the exclusive benefits awaiting you.
- Qlik Community
- :
- All Forums
- :
- QlikView App Dev
- :
- Reference lines for each section of the trellis ch...
- Subscribe to RSS Feed
- Mark Topic as New
- Mark Topic as Read
- Float this Topic for Current User
- Bookmark
- Subscribe
- Mute
- Printer Friendly Page
- Mark as New
- Bookmark
- Subscribe
- Mute
- Subscribe to RSS Feed
- Permalink
- Report Inappropriate Content
Reference lines for each section of the trellis chart
Hello,
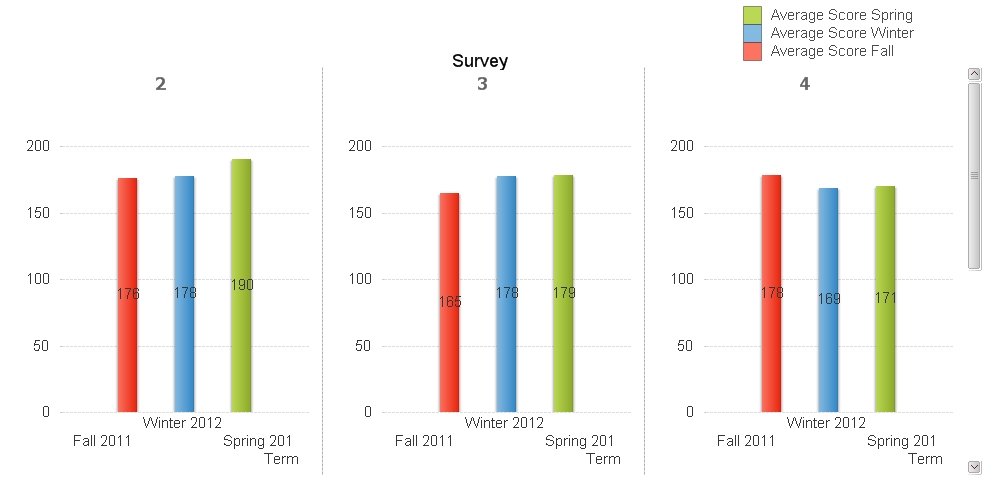
I have data displayed in bar chart with trellis:

I need to have reference lines displayed for each level (2, 3, 4 in the chart above) separatelly.
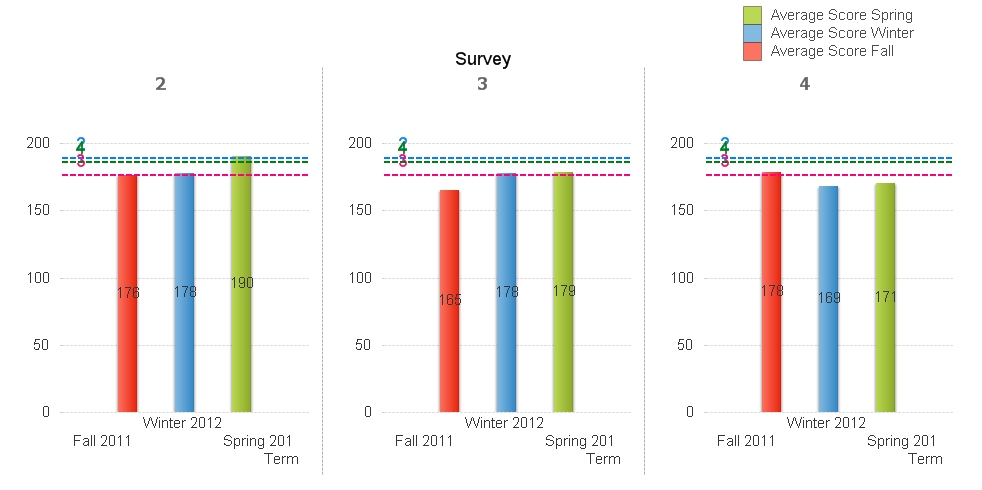
I've created several reference lines, but they all displayed together:

Any suggestions how to do that (display reference line for individual section only)?
I have two dimensions in this chart (Level and Term).
Thank you!
Regards,
Vladimir
Accepted Solutions
- Mark as New
- Bookmark
- Subscribe
- Mute
- Subscribe to RSS Feed
- Permalink
- Report Inappropriate Content
You can build reference lines by actually making the lines part of the chart instead of reference lines. See the attached. The horizontal lines are easy. I used a pick(match()) to generate values, but I assume they're calculated in some way in your real application. The vertical lines are kind of insane, but aren't what you need.
- Mark as New
- Bookmark
- Subscribe
- Mute
- Subscribe to RSS Feed
- Permalink
- Report Inappropriate Content
Hi.
I think you can't use reference lines for that purposes (it seems it's calculated for the entire chart once similar to Max/Min ranges for axises).
Try switch to Combo Chart and add that lines as separate expressions with TOTAL modifier.
Of course the lines will be truncated but it's something to try.
- Mark as New
- Bookmark
- Subscribe
- Mute
- Subscribe to RSS Feed
- Permalink
- Report Inappropriate Content
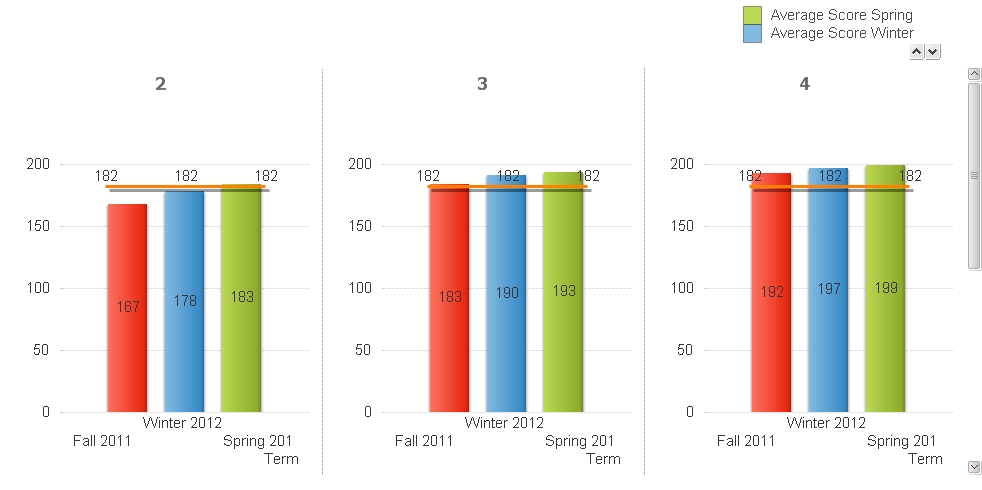
I've tried that before, but this approach does not give me an option to display another expression only at the section I need it at. I can show/hide it, but it appears on all sections of the trellis chart.

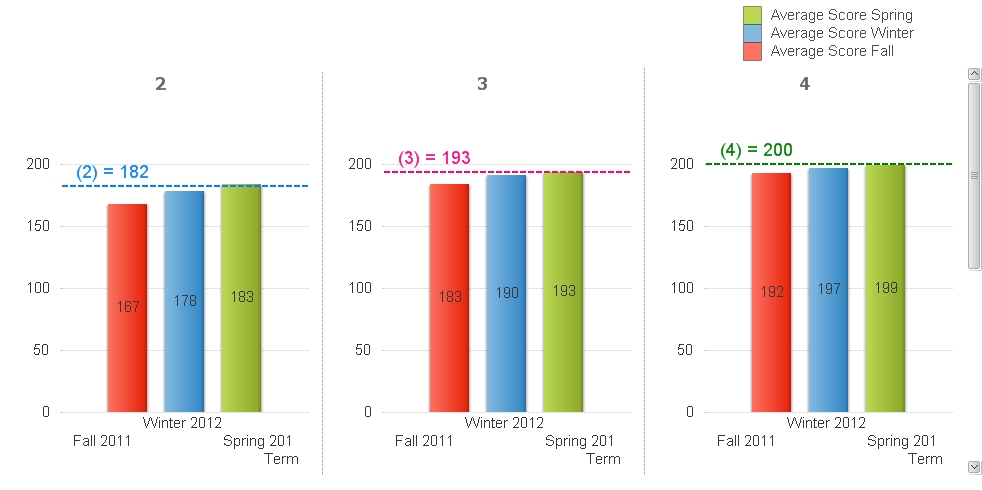
I need something like this:

- Mark as New
- Bookmark
- Subscribe
- Mute
- Subscribe to RSS Feed
- Permalink
- Report Inappropriate Content
You can build reference lines by actually making the lines part of the chart instead of reference lines. See the attached. The horizontal lines are easy. I used a pick(match()) to generate values, but I assume they're calculated in some way in your real application. The vertical lines are kind of insane, but aren't what you need.
- Mark as New
- Bookmark
- Subscribe
- Mute
- Subscribe to RSS Feed
- Permalink
- Report Inappropriate Content
Great idea, John!
This was exactly what I need!
Thank you!
Best regards,
Vladimir
- Mark as New
- Bookmark
- Subscribe
- Mute
- Subscribe to RSS Feed
- Permalink
- Report Inappropriate Content
Hi John, I am not able to view the example attached as I have the personal edition. I am trying to set reference lines for different gross margin targets for different segments / business units. How'd I achieve that?
TIA!