Unlock a world of possibilities! Login now and discover the exclusive benefits awaiting you.
- Qlik Community
- :
- All Forums
- :
- QlikView App Dev
- :
- Report Problem: table in qvw shows different value...
- Subscribe to RSS Feed
- Mark Topic as New
- Mark Topic as Read
- Float this Topic for Current User
- Bookmark
- Subscribe
- Mute
- Printer Friendly Page
- Mark as New
- Bookmark
- Subscribe
- Mute
- Subscribe to RSS Feed
- Permalink
- Report Inappropriate Content
Report Problem: table in qvw shows different value as in Report
Hello,
At a customer of mine we use reporting to create personal reports for a number of employees and franchisees.
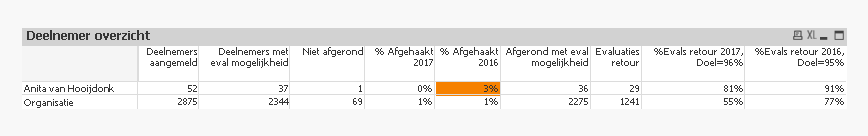
The tables in the report show their achievements compared to the organisational total. Here is the catch... a table as shown on the desktop (attach screen1.png) shows a different value as the same table in the report (attach screen2.png)
The report is looping thru a list of names where as the table uses the getselectedcount() =1 on the name list as a dimension.
As far as I can tell, it looks like the report is ignoring the set analysis part for the total calculation.
The dimension is calculated (coach naam = name of coach, Dimension = Coach or Organisatie):
=if( Order=1 AND GetSelectedCount([coach naam]) = 1, [coach naam] , Dimensie)
The expression of the first column is:
=if(Order=1,
count( {$< participant_end_date={">=$(vTFirst)<=$(vTLast)"}>}DISTINCT participant_id),
count( {$< participant_end_date={">=$(vTFirst)<=$(vTLast)"},[coach naam]= >} TOTAL participant_id))
As written above, on the screen it works as a treat. On the export to PDF (attach screen2.png) it does not.
On the view of the report in edit reports however it shows like it is set on the dashboard. (attach screen3.png).
Previewing it from reporting shows the result as per attach_screen1.png.
Any ideas?? Qlik version is in Qlik version.png
Thanks for any help to get this resolved.