Unlock a world of possibilities! Login now and discover the exclusive benefits awaiting you.
- Qlik Community
- :
- All Forums
- :
- QlikView App Dev
- :
- Re: Reversing axes on scatter chart
- Subscribe to RSS Feed
- Mark Topic as New
- Mark Topic as Read
- Float this Topic for Current User
- Bookmark
- Subscribe
- Mute
- Printer Friendly Page
- Mark as New
- Bookmark
- Subscribe
- Mute
- Subscribe to RSS Feed
- Permalink
- Report Inappropriate Content
Reversing axes on scatter chart
Hello,
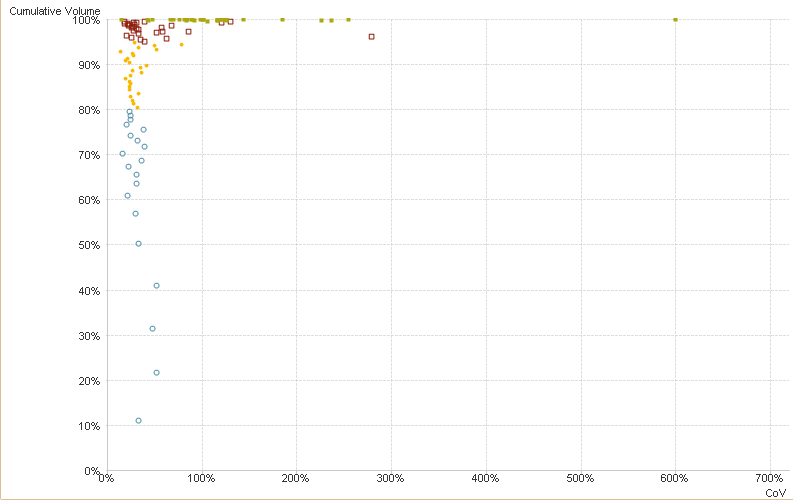
I am trying to reverse my X and Y axes on my scatter chart. (i.e. 0 - 100% should display as 100 - 0%). I would normally adjust sort order in a chart, but as in a scatter chart my dimensions are essentially expressions, and vice versa, I am at a loss as to how to do this.
In addition to reversing the order of both Cumulative Volume and CoV, I would like my X axis to be on the top of the graph and my Y axis to be on the right of the graph.

Thanks for your help!
M
Accepted Solutions
- Mark as New
- Bookmark
- Subscribe
- Mute
- Subscribe to RSS Feed
- Permalink
- Report Inappropriate Content
You could create negative values and format these to be shown without a '-' sign of () for minus.
- Mark as New
- Bookmark
- Subscribe
- Mute
- Subscribe to RSS Feed
- Permalink
- Report Inappropriate Content
You could create negative values and format these to be shown without a '-' sign of () for minus.
- Mark as New
- Bookmark
- Subscribe
- Mute
- Subscribe to RSS Feed
- Permalink
- Report Inappropriate Content
Excellent, thank you!
- Mark as New
- Bookmark
- Subscribe
- Mute
- Subscribe to RSS Feed
- Permalink
- Report Inappropriate Content
Actually, Michiel, could you elaborate a little bit further please?
I was able to reverse my axes by adding a '-' in front of my expression, however I'm not sure how to achieve this without using the '-' sign, or how to hide it?
Thanks very much!
M
- Mark as New
- Bookmark
- Subscribe
- Mute
- Subscribe to RSS Feed
- Permalink
- Report Inappropriate Content
multiply your expression with -1 to create the negative values.
Go to number format and create a negative format just like the positive format:
fixed to: #,##0;#,##0
- Mark as New
- Bookmark
- Subscribe
- Mute
- Subscribe to RSS Feed
- Permalink
- Report Inappropriate Content
Hi Michiel,
I have multiplied the expression with -1 and now when I go to Number tab and select Fixed to for y expression and change the format from #,##0 to #,##0;#,##0 , there is no change.
Can you please help me with this.
Thanks,
Niharika
- Mark as New
- Bookmark
- Subscribe
- Mute
- Subscribe to RSS Feed
- Permalink
- Report Inappropriate Content
Can you post some printscreens?
- Mark as New
- Bookmark
- Subscribe
- Mute
- Subscribe to RSS Feed
- Permalink
- Report Inappropriate Content
Hi Niharika,
Make sure you check the following option on the chart properties.
Ex: If you would like to reverse Y axis, then Check Static Max option and set to 0 for that particular axis.
- Mark as New
- Bookmark
- Subscribe
- Mute
- Subscribe to RSS Feed
- Permalink
- Report Inappropriate Content
Thanks Swetha,
That's really helpfull.