Unlock a world of possibilities! Login now and discover the exclusive benefits awaiting you.
- Qlik Community
- :
- All Forums
- :
- QlikView App Dev
- :
- Re: Rolling 12 Month Average
- Subscribe to RSS Feed
- Mark Topic as New
- Mark Topic as Read
- Float this Topic for Current User
- Bookmark
- Subscribe
- Mute
- Printer Friendly Page
- Mark as New
- Bookmark
- Subscribe
- Mute
- Subscribe to RSS Feed
- Permalink
- Report Inappropriate Content
Rolling 12 Month Average
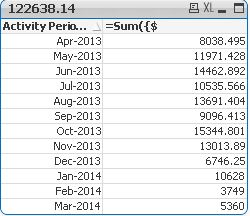
Right, battled hard over that last few days to figure this one out but I had no luck. Hopefully someone here will be able to help:
the following set analysis is used to create the respective chart:
=Sum({$<[Milestone Num]={27},
[Activity Measure Code]={'WATER'},
[Activity Period Month Year]={">=$(vStartMonthYear)<=$(vEndMonthYear)"}>}
[Activity Value])
Dimension=[Activity Period Year Month]

As you can see the vStartMonthYear and vEndMonthYear are variables that let me garb the Year to date range.
The figures displayed in the chart are not what the users are after, instead of having a sum for the month, they want a sum for the 12 months leading to the month.
So, for example the value for:
Apr-2013 will be a sum of May-2012 to Apr-2013
May-2013 will be a sum of Jun-2012 to May-2013
Jun-2013 will be a sum of Jul-2012 to Jun-2013
and so on....
As well as the sum, they also want the average, which should be easy as it will always divide by 12.
I believe this is how a rolling 12 month average works, so i'm hoping someone has achieved this in QlikView.
I would like the table to be displayed as above with the same dimension.
is this possible with set analysis, if so, how??
- Mark as New
- Bookmark
- Subscribe
- Mute
- Subscribe to RSS Feed
- Permalink
- Report Inappropriate Content
- Mark as New
- Bookmark
- Subscribe
- Mute
- Subscribe to RSS Feed
- Permalink
- Report Inappropriate Content
Hi manishkachhia I have already seen this and used it to achieve an accumulation of the value over 12 months, so:
Jan = Jan
Feb = Jan+Feb
Mar = Jan+Feb+Mar
The article was good for this, however my challenge I believe is slightly different in that against a month (eg. Apr-2013) I want to go and get the sum for the 12 months previous (eg. May-2012 to Apr-2013) and put this sum against the month of Apr-2013.
- Mark as New
- Bookmark
- Subscribe
- Mute
- Subscribe to RSS Feed
- Permalink
- Report Inappropriate Content
Try to use MonthYear instead of Month used in that post.
Otherwise, upload your sample file...
- Mark as New
- Bookmark
- Subscribe
- Mute
- Subscribe to RSS Feed
- Permalink
- Report Inappropriate Content
Hi
I assume you want to see the monthly (in column 1) as well as the cumulative, and the average:
Cumulative:
=RangeSum(Column(1), 0, RowNo())
Average:
=RangeSum(Column(1), 0, RowNo()) / RowNo()
HTH
Jonathan
- Mark as New
- Bookmark
- Subscribe
- Mute
- Subscribe to RSS Feed
- Permalink
- Report Inappropriate Content
Hi Jonathan, I dont believe this will work as how would I maintain my original set of dimensions and then for each dimension (month) go back 12 months to do the sum?